
This CGM guide is structured around decision-relevant risk, not marketing claims.
It starts by separating CGMs we can reasonably trust from those where real-world risk is still uncertain. Before talking about features or performance, the guide asks a simpler question: what happens when this device is wrong, and how often does that matter?
Only once risk is clear does the guide move to accuracy. For CGMs with well-understood risk profiles, we look at what “accurate” actually means in practice. The best systems are reliable the vast majority of the time, but none are perfect. There remains a small but meaningful window where finger-prick checks are still necessary, and pretending otherwise creates avoidable harm.
With that foundation in place, the guide then compares what the leading CGMs actually offer: where they differ, what they do well, and which trade-offs may suit different people, bodies, and lifestyles.
Finally, the guide turns to outcomes: how to use CGM data to improve time-in-range without chasing noise. This section integrates evidence, practical implementation, and lived experience — focusing on the levers that actually move glucose, not esoteric tricks that look clever but rarely survive contact with real life.
It’s essential to read this page first to understand risk.
However, if you understand risk, start at the point that suits you.
- How to choose a CGM system (this page): (1) Understanding risk, (2) How much time-in-range you need varies by CGM system (70% or >75%)?
- How accurate are CGM systems? Evidence-based accuracy and performance — once risk is understood.
- What functions do different CGM systems offer? Alarms, sharing, integrations, and the practical differences that affect real life.
- Top 10 tips for optimising time-in-range using CGM: Practical behaviours and settings that improve outcomes.
- The CGM Black Swan: The uncomfortable edge cases: unknown risk, missing data, and why “approved” isn’t the same as “well-tested”.
What is Continuous Glucose Monitoring (CGM)?
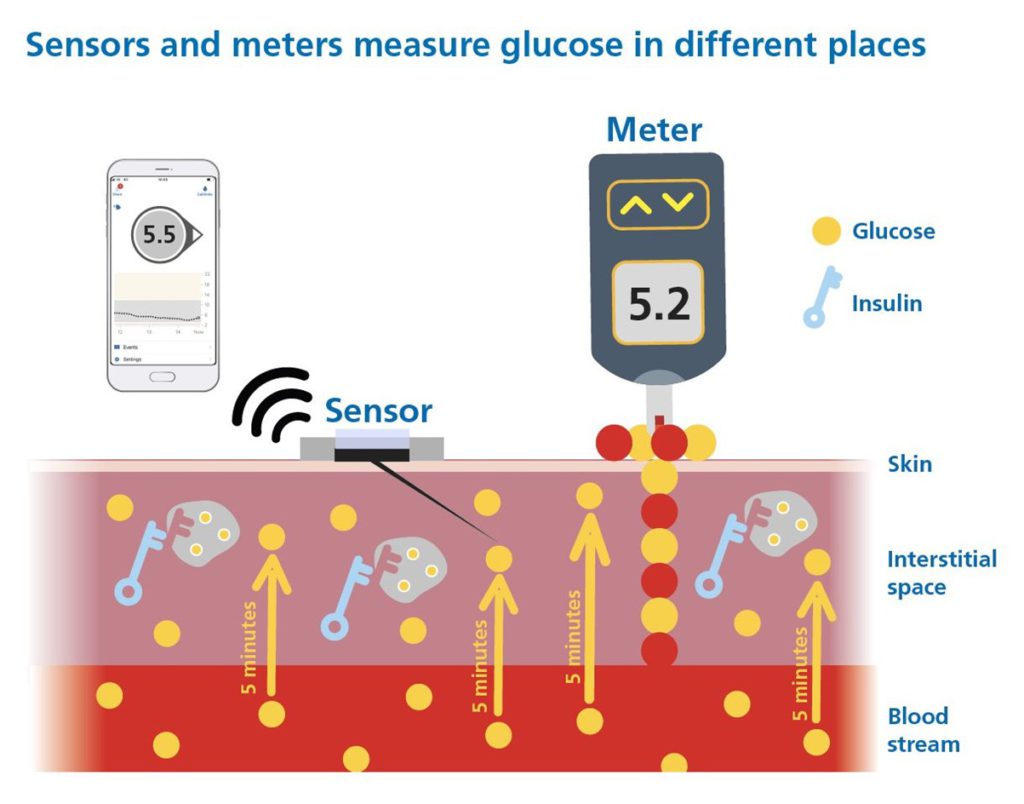
A Continuous Glucose Monitor (CGM) is a wearable device that tracks glucose levels day and night, providing real-time readings, trend arrows, and alerts for high and low glucose. CGMs are now central to diabetes management, giving insight far beyond traditional finger-prick blood glucose monitoring.
The picture below shows how CGM works and how trend arrows let you “see into the future” of your glucose levels.
For the basics, start with CGM Foundations — how continuous glucose monitoring can guide bolus insulin decisions — and then explore the GAME-SET-MATCH framework for dynamic glucose management strategies.
However, not all CGMs are created equal, and choosing the right one requires far more than comparing headline accuracy numbers and app features.
Adjunctive vs non-adjunctive CGM – why it matters
CGM systems fall into two broad categories:
- Adjunctive CGM – requires confirmation with finger-prick blood glucose (SMBG) before insulin dosing and hypoglycaemia treatment.
- Non-adjunctive CGM – approved for insulin dosing decisions and hypoglycaemia treatment without mandatory finger-prick checks.
This guide focuses only on systems with non-adjunctive approval.
When we are using CGM for insulin dosing and hypo treatment, risk assessment comes first — then performance.
Why risk assessment comes first
It’s essential to first understand the risk profile of each device.
Think of choosing a CGM like scouting a football player:
If I claimed I had scored as many goals as Messi and Ronaldo, but cost half the price, should you sign me immediately?
Or would you first ask:
- Where did you score those goals? (Top leagues or Sunday league?)
- How competitive were the matches? (Training games or real fixtures?)
- How do you perform at the highest level, under real pressure?

Five key questions for CGM accuracy studies
The answers tell us whether the CGM has been tested across the full glucose range (typically 2.2–22.2 mmol/L or 40–400 mg/dL) and at the rates of change that occur in daily life.
Q1. Has the data been peer-reviewed or reviewed by the FDA?
High-quality CGM evaluations are reviewed either by:
- Reputable diabetes technology journals, and/or
- Regulators such as the FDA.
That scrutiny covers study design, participant selection, test procedures, and outcomes. It allows clinicians, people with diabetes, and regulators to critique the evidence themselves.
We need this level of transparency considering CGM readings are used to make decisions about a drug (insulin) that carries one of the highest risks of any self-administered medicine.
Q2. Is there sufficient data on people with type 1 diabetes?
Data sufficiency exists to ensure that reported CGM accuracy reflects clinical risk. For insulin dosing, evidence must be independent, representative, and collected under conditions where treatment decisions are actually made. This requires coverage across the full glucose range (including hypoglycaemia and marked hyperglycaemia), across the full sensor lifecycle (early, mid, and late wear), and across a sufficiently large number of individuals to capture between-person variability and real-world failure modes. Data volume alone is insufficient if measurements are clustered within too few people or too narrow a set of conditions.
Participant number is therefore the primary anchor, with 50 participants (>70% with T1D) as the baseline, with> 5,500 independent data points, or less than 50 wearing multiple sensors on the same site, where an equivalence calculation is required to show equivalence to 50 independent wearers with >5,500 data points.
Q3. Were meal and insulin challenges performed?
A robust accuracy study should deliberately trigger high and low glucose episodes, as per Performance Metrics for Continuous Interstitial Glucose Monitoring (POCT05).
- Food without insulin → rapid glucose spikes.
- Too much insulin without food → fast drops and hypoglycaemia (“rage bolus” territory).
Without these challenges, and without 70% having type 1 diabetes, the CGM may never be tested in the very scenarios where accuracy matters most.
Q4. What percentage of comparison readings were < 4.4 mmol/L (80 mg/dL)?
At least 8% of paired CGM vs comparator readings should be below 4.4 mmol/L (80 mg/dL), as per Performance Metrics for Continuous Interstitial Glucose Monitoring (POCT05).
No one is aiming for 8% hypoglycaemia in real life. This threshold simply ensures enough data in the low range to meaningfully assess performance.
Q5. What percentage of comparison readings were > 16.7 mmol/L (300 mg/dL)?
At least 5% of paired readings should exceed 16.7 mmol/L (300 mg/dL), to adequately test performance in the very high range, as per Performance Metrics for Continuous Interstitial Glucose Monitoring (POCT05).
If these extremes are not well represented, the CGM’s ability to reliably detect dangerous highs and lows is unknown. That uncertainty is not acceptable when we are using readings to treat hypos or to deliver large correction doses.
Which CGMs with insulin dosing approval have been tested robustly?
The most up-to-date DSN Forum Chart is hosted on their website. The first chart uses the five study-design questions above to identify which CGM devices have been tested using methods that meet basic international standards.
It provides an overview of CGM systems currently available in the UK and Europe and gives each device a study design score out of 5.
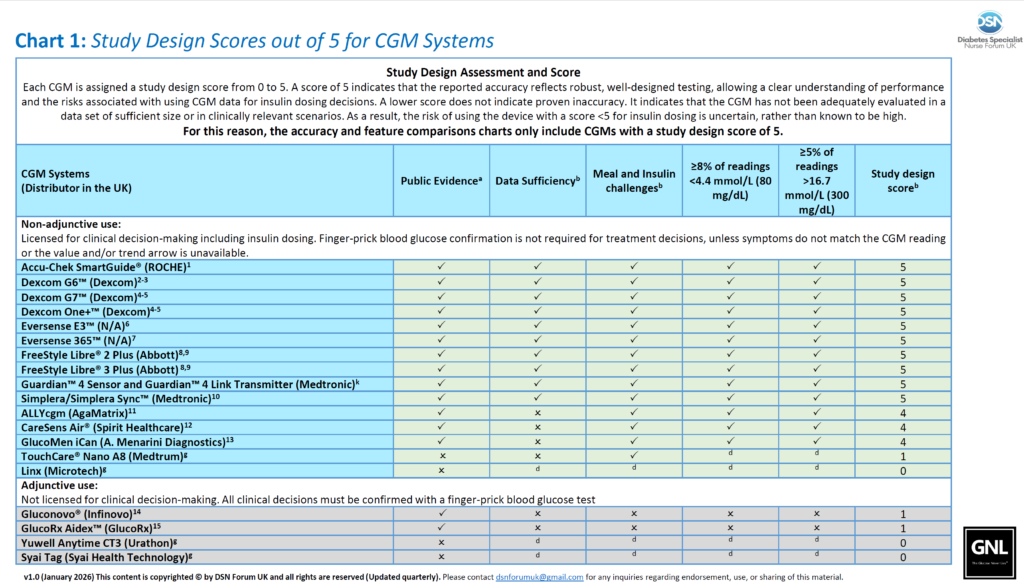
Any CGM system with a study design score less than 5 does not provide enough evidence to understand the risk when using for insulin dosing. Specifically, the risk of using readings in the low and very high glucose ranges — exactly where clinical and insulin dosing decisions are made.
This remains true even if a CGM system has a CE mark for non-adjunctive use across a wide age range.
More recently, CE marking for CGMs used to drive automated insulin delivery (AID), without peer-reviewed published data, has triggered serious concerns. These have been highlighted by paediatric endocrine societies and adult diabetes technology networks.
This does not mean those CGMs and AIDs are unsafe; it means we do not know the risk.
From this point forward, we only discuss CGM systems with a study design score of 5. They are;
- Accu-Chek SmartGuide
- Dexcom G6
- Dexcom One
- Dexcom G7
- Dexcom One+
- EverSense
- FreeStyle Libre 2 and 2 Plus
- FreeStyle Libre 3 and 3 Plus
- Medtronic Guardian 4
- Medtronic Simplera
To be clear, risk assessment always comes first, with no free passes. For a deeper explanation (not needed for most), see CGM Black Swan.
How much time-in-range you need varies by CGM system (70% or 75%)
Do all CGM’s display equivalent glucose levels on their screens, pumps or AID systems?
Simply, no.
Each CGM shows, on average, glucose values that can sit above, within, or below the blood glucose your body is actually exposed to. This is pronounced when the glucose levels are rising and go above 10.0 mmol/L (>180 mg/dL).
That matters when you’re thinking about how much time in range (3.9–10.0 mmol/L / 70–180 mg/dL) you should aim for.
The same person using different CGMs — can have the same biology but end up with different reported time in range, by up to 10%.
In other words, time in range is only meaningful if you understand which Zone your CGM reads in, especially when above 10.0 mmol/L (180 mg/dL)
This is the CGM Alignment Zone model adapted from:

Zone A: reads above true glucose
These systems read higher than true physiological glucose, resulting in delayed detection of hypoglycaemia and overstating hyperglycaemia. This is concerining when the glucose levels are rising and go above 10.0 mmol/L (>180 mg/dL), and risks over-delivery of insulin.
Zone P: reads within true physiological glucose exposure
These systems, on average, align with true glucose exposure, reading between capillary and venous glucose, especially glucose levels are rising and go above 10.0 mmol/L (>180 mg/dL). Every major CGM evidence dataset (TIR → HbA1c mapping, complication risk modelling, pregnancy outcomes) was built using Zone P systems (mainly Dexcom G4/G5/G6/G7 with some FreeStyle Libre 2/3). When targets say “70% TIR”, they assume you are using a Zone P device.
Zone B: reads below true physiological glucose
These systems typically read lower than venous glucose. This is espacially true when rising above 10.0 mmol/L (180 mg/dL), where they can read up to 10% lower. They smooth post-meal peaks, and make TIR appear higher than actual glucose exposure.
To match the long-term risk profile of a Zone P system achieving 70% TIR, a Zone B device usually requires >75% TIR. But don’t fret: getting an extra 5-10% TIR on a Zone B system is typically easier than on a Zone P system.
Zone UNKNOWN: We do not have enough data to be sure
Most worryingly, for some systems we don’t know whether they read above, within, or below true blood glucose, because the relevant performance data aren’t publicly available, or lack depth.
Where current CGM systems sit
We don’t think there any Zone A systems on the market, but, with the lack of transparency in data, it is possible. All established CGM systems fall into Zone P or Zone B.
CGM systems reading in Zone P
On average, these systems read in line with physiological glucose exposure, particularly at glucose concentrations above 10.0 mmol/L (180 mg/dL).
Meta-analysis data shows on average, ~70% time-in-range is needed to achieve an A1c of 7.0% for Zone P CGM systems.
| Device | Manufacturer | Bias to Venous Blood Glucose (when above 10.0 mmol/L or 180 mg/dL) | Comparator |
|---|---|---|---|
| FreeStyle Libre 2 / 2 Plus / 3 / 3 Plus | Abbott | +5% | Venous |
| Dexcom G7 / ONE+ | Dexcom | +5% | Venous |
| Dexcom G6 / ONE | Dexcom | +2% (estimated) | Arterialised Venous |
| Accu-Chek SmartGuide | ROCHE | +2% (estimated) | Capillary |
CGM systems reading in Zone B
On average, these systems read below physiological glucose exposure, particularly at glucose concentrations above 10.0 mmol/L (180 mg/dL).
Meta-analysis data shows on average, >75% time-in-range is needed to achieve an A1c of 7.0% for Zone B CGM systems.
| Device | Manufacturer | Bias to Venous Blood Glucose (when above 10.0 mmol/L or 180 mg/dL) | Comparator |
|---|---|---|---|
| Eversense E3 / 365 | Senseonics | −2% | Venous |
| MimMed Simplera / Guardian 4 | Medtronic | −10% | Venous |
Let’s move forward to assessing the accuracy of the CGM systems where their risk is understood, and the zone is known.
They are in order, but take your pick: