Mealtime Insulin Guide
Mealtime Insulin: Predictability, not Perfection
The lasagne is on the plate, the kids are at the table, and the bolus question lands the same way it has landed for years. How much, how soon, and what is the meal going to do for the next four hours that the dose has to keep up with. This guide names the three meal patterns most people meet, the timing and dose-shape decisions that go with each, and the practical truth that the goal is predictability, not perfection.
Ask Grace
Want to ask which pre-bolus window fits your insulin, or how to size a split bolus for a fat-and-protein meal? Ask Grace.
Why mealtime insulin is structurally hard
If mealtime feels harder than basal or correction work, that is not a skill failure. It is a structural one. In people without T1D, insulin is released straight into the portal vein, reaching the liver first and damping the post-meal rise before it ever shows up in the bloodstream. Injected or pumped insulin does not get that route. It sits in the subcutaneous tissue and absorbs slowly, reaching the liver later and at lower concentration than the body would have managed on its own. So even when the dose is right, timing and meal composition can produce spikes, late drops, or both.
The teaching I lean on most heavily here, in DAFNE clinics and in conversations with families at Birmingham Women’s and Children’s, is that the carb-ratio you have been given is doing more work than people realise. It was tuned on usual mixed meals; it already covers the meal-pattern most people eat most of the week. When the meal stays inside that pattern, the ratio holds. When the meal steps outside it, the ratio is not broken. The meal has changed.
The 130 percent ICR insight
The single most useful number in mealtime dosing is one that almost no one has been told. The insulin-to-carbohydrate ratio set with your team is a mixed-meal ratio, not a carbohydrate-only ratio. Worked out on usual meals, around 40 to 55 percent carbohydrate by energy with 10 to 20 percent protein and 20 to 40 percent fat, it covers approximately 130 percent of the insulin a carbohydrate-only meal would need (Pemberton 2021, Pediatric Diabetes). That single observation explains three things at once. Fruit-only meals matched gram-for-gram with the ratio go low afterwards. Pizza, fry-ups, and cheesy pasta run high for hours despite perfect counting. Usual mixed meals work fine, because that is what the ratio was designed for.
The practical implication is not that the ratio is wrong. It is that the ratio is calibrated to a window. Carb-only meals undershoot the window, so they need less insulin. Fat-and-protein-heavy meals overshoot it, so they need more insulin and a different dose shape. Most meals fall in the middle, and the ratio looks after them.
Pre-bolus timing, the lever you can move
Of every single move you can make at mealtime, the cheapest one to start with is also the most reliable. Bolusing around 20 minutes before the first bite of a usual mixed meal, on a standard rapid analogue, is the dose-timing change that most consistently lowers the post-meal spike (Slattery 2018, Diabetic Medicine). The mechanism is the timing mismatch the previous section described: the food arrives in minutes; the analogue insulin starts in tens of minutes. Closing the gap before the meal starts is the closest you can get to giving the insulin a fair chance.
Two practical points the figure does not say loud enough. First, the optimal pre-bolus window is not 20 minutes for everyone, every meal, every starting glucose. It is 20 minutes for a typical adult with rapid analogue insulin (Humalog, NovoRapid, Apidra) starting from a glucose in the target range. If the starting glucose is low, the window shrinks; if the starting glucose is high, it lengthens. Second, the ultra-rapid analogues (Lyumjev, Fiasp) absorb faster from the depot than the older rapids (Leohr 2021, Clinical Pharmacokinetics), so they need a shorter pre-bolus, sometimes none at all. The principle holds, the number changes with the analogue.
The fat-and-protein meal, the curve that does not behave
The lasagne, the cheese-laden pasta, the takeaway curry, the slow-cooked Sunday roast. These meals are where the standard ratio and the standard pre-bolus timing both miss, in the same way, every time. Glucose rises later, lower, and longer. The first hour after eating looks fine. The first two hours look fine. Then around hour three the line starts rising and does not come back down for another two or three hours. People who have lived with this know the pattern; people who have not can spend years correcting the second-half rise and finding the corrections themselves do not land cleanly either.
The dose response that fits this curve has two parts. There is more insulin overall, because fat and protein contribute to glucose late in the digestive process; and there is a different dose shape, because a single up-front bolus would land long before the second peak arrives. On a pump, that is a split bolus, often around 50 percent up front and 50 percent extended over two to three hours. On injections, that is a smaller dose at the start and a top-up around hour two. The percentages from Pemberton 2021 give a population-average starting point: roughly plus 30 to 35 percent on top of the usual carb-only insulin for a high-fat-and-carb meal, and roughly plus 50 percent for a high-fat-and-protein-and-carb meal. Variability across people is genuinely wide, minus 17 to plus 124 percent in the source studies, so these numbers are starting points to refine with CGM and the diabetes care team, never instructions to follow.
The dosing matrix, in plain English
Five meal patterns cover most of what comes off a real kitchen counter. The same carb-ratio you have been given handles the middle three; the carb-only and the high-fat-and-protein cases are where the adjustment lever moves. Tap each pattern for the practical detail.
Carb-only meals (fruit, dry toast, sweets)
The mixed-meal ratio overshoots a carb-only meal by roughly 30 percent. Reducing the dose by around 30 percent (the ratio multiplied by approximately 0.7) lands closer for most people. Standard pre-bolus timing applies. Variability is low; this case is the most predictable.
Usual mixed meals (the everyday pattern, 40 to 55 percent carb by energy)
The ratio is the right ratio. Single bolus pre-meal, around 20 minutes ahead on a rapid analogue, less or none on an ultra-rapid. This is the pattern the ratio was tuned for, and it is the pattern most days look like. Variability is low.
High-protein meals (40 g or more protein with at least 30 g carb)
Roughly plus 15 to 20 percent on the carb-only insulin, single bolus pre-meal. Protein contributes glucose through gluconeogenesis later in digestion, so the extra insulin is small but real. Variability is moderate.
High-fat-and-carb meals (35 g or more fat with at least 30 g carb)
Roughly plus 30 to 35 percent on the carb-only insulin, split 50 percent up front and 50 percent over two to three hours. Pizza, chips, creamy pasta, fish-and-chip suppers fall here. Variability is wide (minus 17 to plus 108 percent across people in Wolpert 2013 and Bell 2016); the matrix figure is a starting point.
High-fat-and-protein-and-carb meals (35 g+ fat, 40 g+ protein, 30 g+ carb)
Roughly plus 50 percent on the carb-only insulin, split 50 percent up front and 50 percent over two to three hours. Lasagne, cheeseburgers and fries, slow-cooked stews with rice fall here. Variability is widest of all (plus 24 to plus 124 percent across people); refine with CGM and the diabetes care team. No “take X units” framing; this is a percentage adjustment against a ratio you and your team set.
The matrix gives a population-average starting point. The actual numbers belong to you, your insulin, your activity, and the meal in front of you. Consistency is what makes these numbers reliable. The more your meals stay inside the usual mixed-meal pattern most of the week, the more the ratio holds when you ask it to. Variability in the meal is variability in the dose.

What I do at home, what we teach in DAFNE
I live with T1D myself. The first move that mattered for me was the pre-bolus on breakfast: 20 minutes ahead of the porridge bowl, on the train, took the morning spike from routine to occasional. Nothing about the dose changed, only the timing. The second move was the split bolus on lasagne; around plus 40 percent on the carb dose, half up front and half over two and a half hours, is what landed for me. The principle is general, the numbers are mine.
What we teach in structured education (DAFNE, BERTIE-online, the BWC DYNAMIC and GAME programmes) is the same shape: count the carbs accurately, pre-bolus on the rapid analogue, watch the CGM, refine with your team.
The mealtime ratio is a window, not a number. Calibrated on usual mixed meals, it covers the middle of the week reliably; carb-only meals undershoot the window, fat-and-protein-heavy meals overshoot it, and the matrix above shows where the population-average adjustment lever moves. Pre-bolus timing is the single cheapest move on most usual meals; dose-shape is the single most important move on most high-fat-and-protein meals. Predictability comes from staying inside the window most days, and adjusting deliberately when the meal steps outside it.
This content is for educational exploration only. It describes population-average responses and general principles, not personalised dose advice. The percentages given are starting points to refine with CGM and your diabetes care team, who hold your individual ratio and correction factor.
Strategies that lower the post-meal spike
The pre-bolus is the headline. Half a dozen smaller moves stack with it and add up to a meaningfully calmer post-meal hour. None of them require new equipment; all of them are clinic conversations worth having if you have not already.
Choose mainly low-glycaemic-index carbohydrates
Slower-digesting carbs (oats, lentils, wholegrain bread, basmati rice) raise glucose more gradually, which gives the insulin time to catch up. The same carb count, slower delivery to the bloodstream, smaller spike.
Move for at least ten minutes after eating
A short walk or some light housework right after the meal increases muscle uptake of glucose and reduces the size of the peak. It is the move with the lowest cost and one of the most reliable effects.
Inject into the abdomen or upper arm rather than the leg
Subcutaneous absorption is fastest from the abdomen, second fastest from the upper arm, and slowest from the outer thigh. For mealtime doses, the faster sites help close the timing gap. Rotate within the chosen area to avoid lipohypertrophy.
Split very large doses
A single insulin depot above around 10 to 15 units absorbs more slowly than the same dose split into two depots at separate sites. By injection, two equal halves at least 2 cm apart. By pump, a split or extended bolus across 15 to 30 minutes for the up-front half.
Super bolus on a pump (clinic conversation first)
Borrowing the next two hours of basal into the up-front bolus increases the early effect on the meal spike and reduces basal action while the meal lands. It is a useful tool for the breakfast spike in particular. Only set up with your diabetes care team, never DIY.
Stay closer to 40 than 55 percent carbohydrate of total energy where possible
A lower-carb mixed-meal pattern still sits inside the window the ICR was tuned for, and produces smaller spikes overall. Three balanced meals a day, limited grazing, consistent macronutrient split: the structural changes that make the dose-timing changes more reliable.
What changes on AID, and what does not
Hybrid closed-loop systems take over the basal layer and the small in-between corrections, and they leave the meal bolus largely with you. The carb count, the pre-bolus timing, and the dose-shape decision for fat-and-protein meals are still yours. The places AID struggles most are the places your input matters most: the high-fat-and-protein meal that asks for an extended bolus the algorithm cannot infer from carbs alone, and the underestimated carb count that runs the post-meal high for hours. The systems quieten the rest of the day so there is more attention left for the meals.
References
Pemberton 2021, Mealtime Insulin Guide (the 130 percent ICR insight, dosing matrix)
Pemberton J, et al. The Glucose Never Lies Mealtime Insulin Guide for type 1 diabetes. Pediatric Diabetes. 2021. COI flag: John Pemberton is lead author. The matrix percentages and the 130 percent ICR observation come from this paper.
Pemberton 2019, KISS audit at Birmingham Women’s and Children’s NHS FT
Pemberton J, et al. Keep It Super Simple: a structured-education audit. Pediatric Diabetes. 2019. COI flag: John Pemberton is lead author. Anchors the structured-education curriculum that informs the practical sections above.
Slattery 2018, optimal prandial bolus timing review
Slattery D, Choudhary P. Clinical use of continuous glucose monitoring in adults with type 1 diabetes, optimal prandial bolus timing. Diabetic Medicine. 2018. The clinical literature anchor for the 20-minute pre-bolus on rapid analogues for usual mixed meals.
Leohr 2021, ultra-rapid lispro pooled PK/PD analysis
Leohr J, et al. Pharmacokinetics and glucodynamics of ultra-rapid lispro versus lispro across a clinically relevant range of subcutaneous doses. Clinical Pharmacokinetics. 2021. N=190 clamp-study analysis. Shapes the shorter pre-bolus on Lyumjev and Fiasp.
Wolpert 2013 and Bell 2016, fat-and-protein dose adjustments and the variability range
Wolpert HA, et al. Dietary fat acutely increases glucose concentrations and insulin requirements in patients with type 1 diabetes. Diabetes Care. 2013. Bell KJ, et al. Optimised mealtime insulin dosing for fat and protein in type 1 diabetes. Diabetologia. 2016. The two studies behind the minus 17 to plus 124 percent variability range and the dose-shape recommendations for high-fat meals.
The three meal patterns, in depth
The hub gives the framework. The three parts that follow take each meal pattern in turn, with the keystone diagrams that have been in use across the GNL community for years. Read in sequence if it is the first time through; otherwise, jump to the part that matches the meal in front of you tonight.
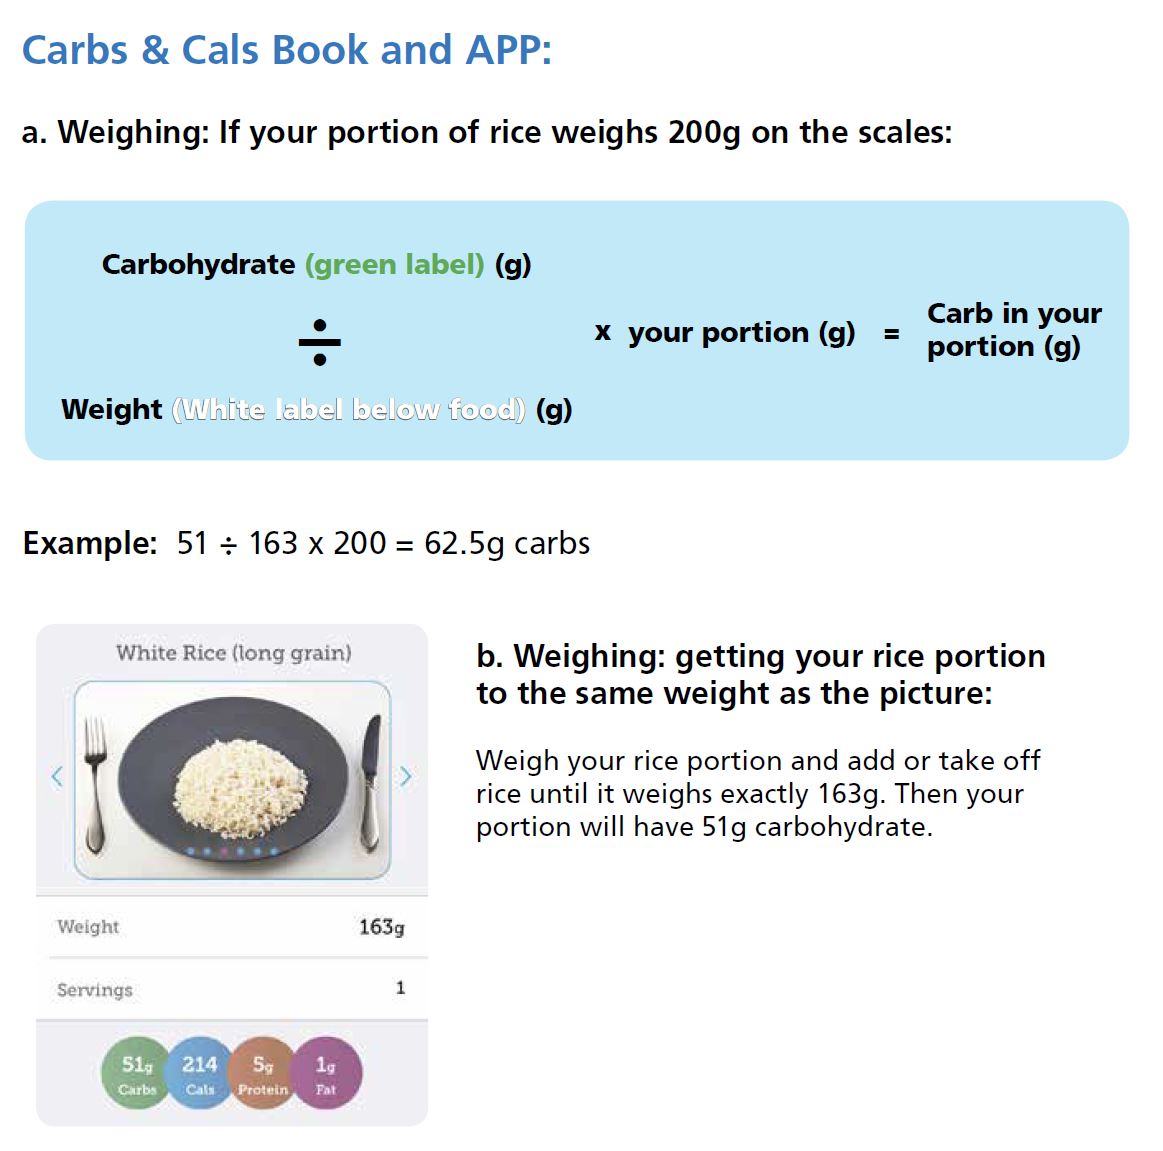
Part 1: High-Carb Meals, Smashing the Spike
Cereal, jacket potato with beans, toast and jam. Carbohydrate enters the bloodstream faster than injected insulin can act, so the spike is the predictable result. The page walks the mechanism (portal-vein bypass, slow subcutaneous absorption) and the moves that close the timing gap most reliably (pre-bolus, post-meal walking, food-sequencing).
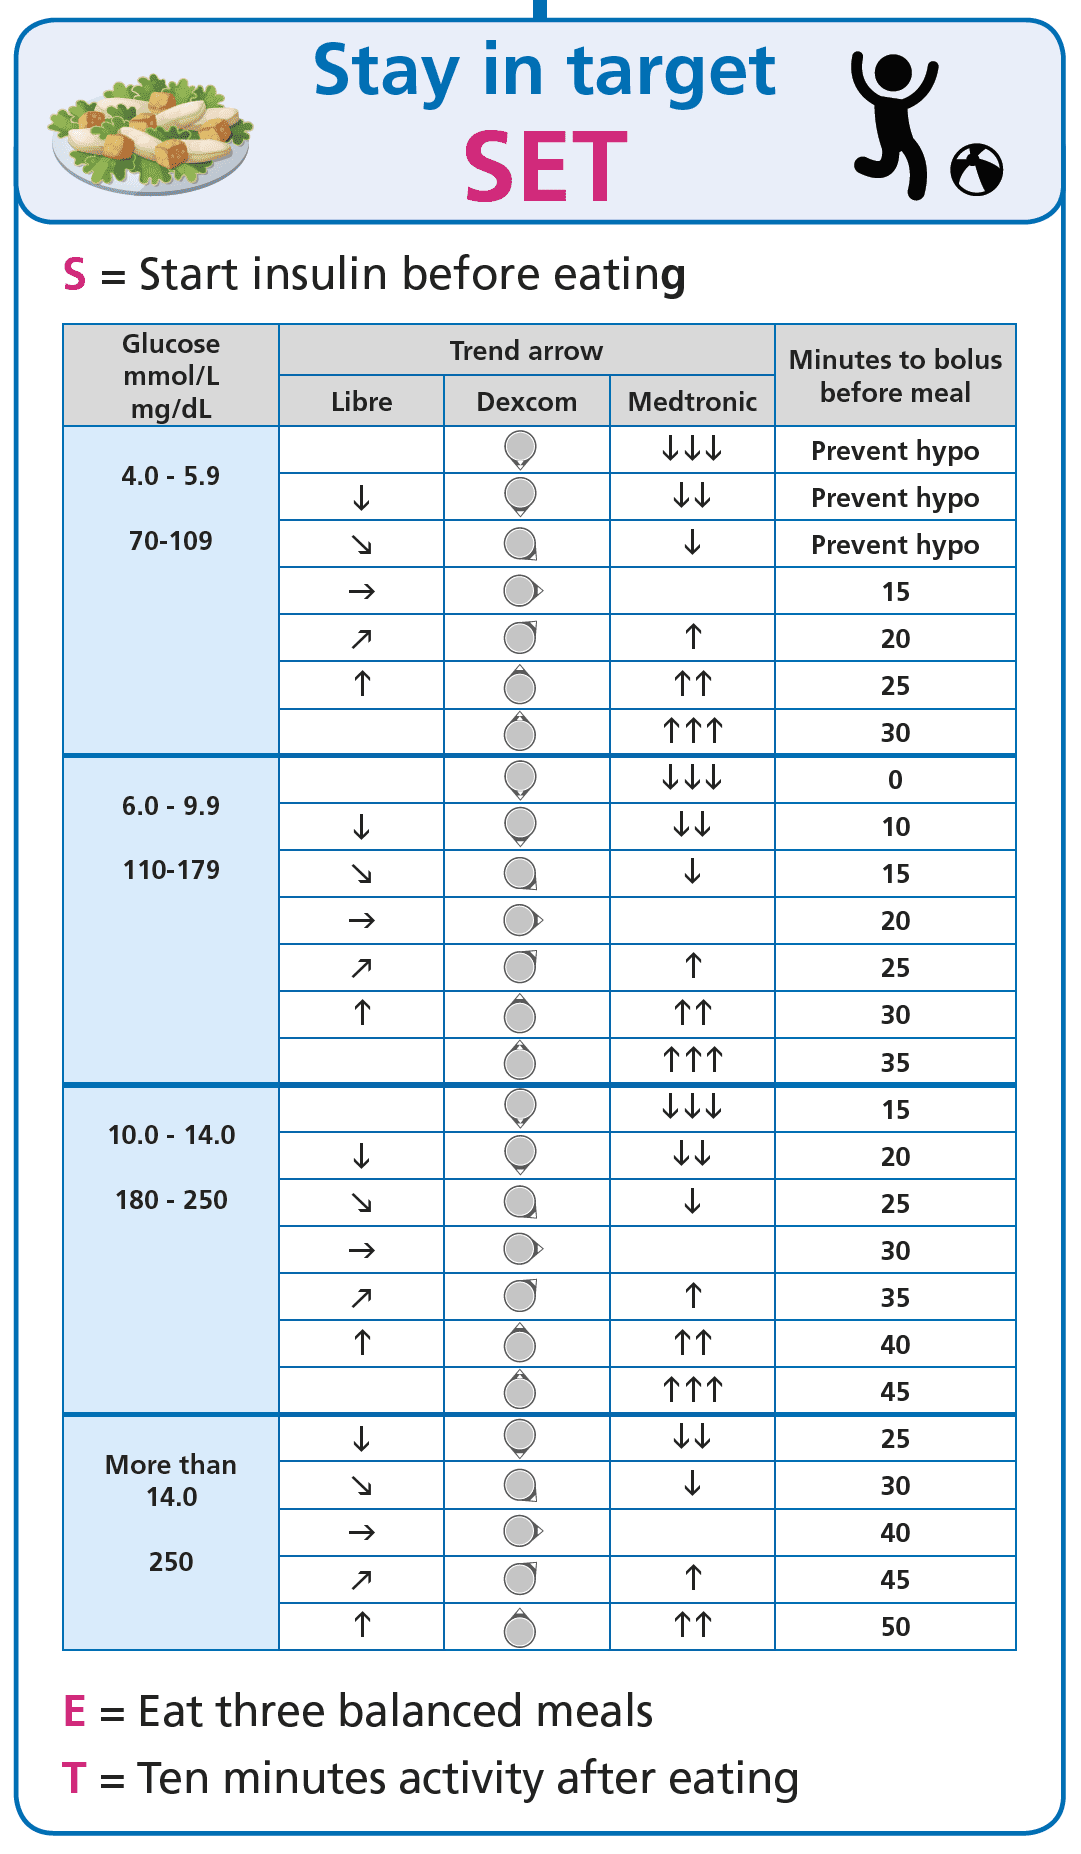
Part 2: Balanced Meals, Stay in Range
Half a plate of vegetables, a palm of protein, a fist of carbohydrate. Balanced meals produce a smaller, slower glucose rise and make insulin timing predictable enough to learn from. The page walks the plate model and the two SET-framework tactics that flatten the post-meal curve when the structural pattern is in place.
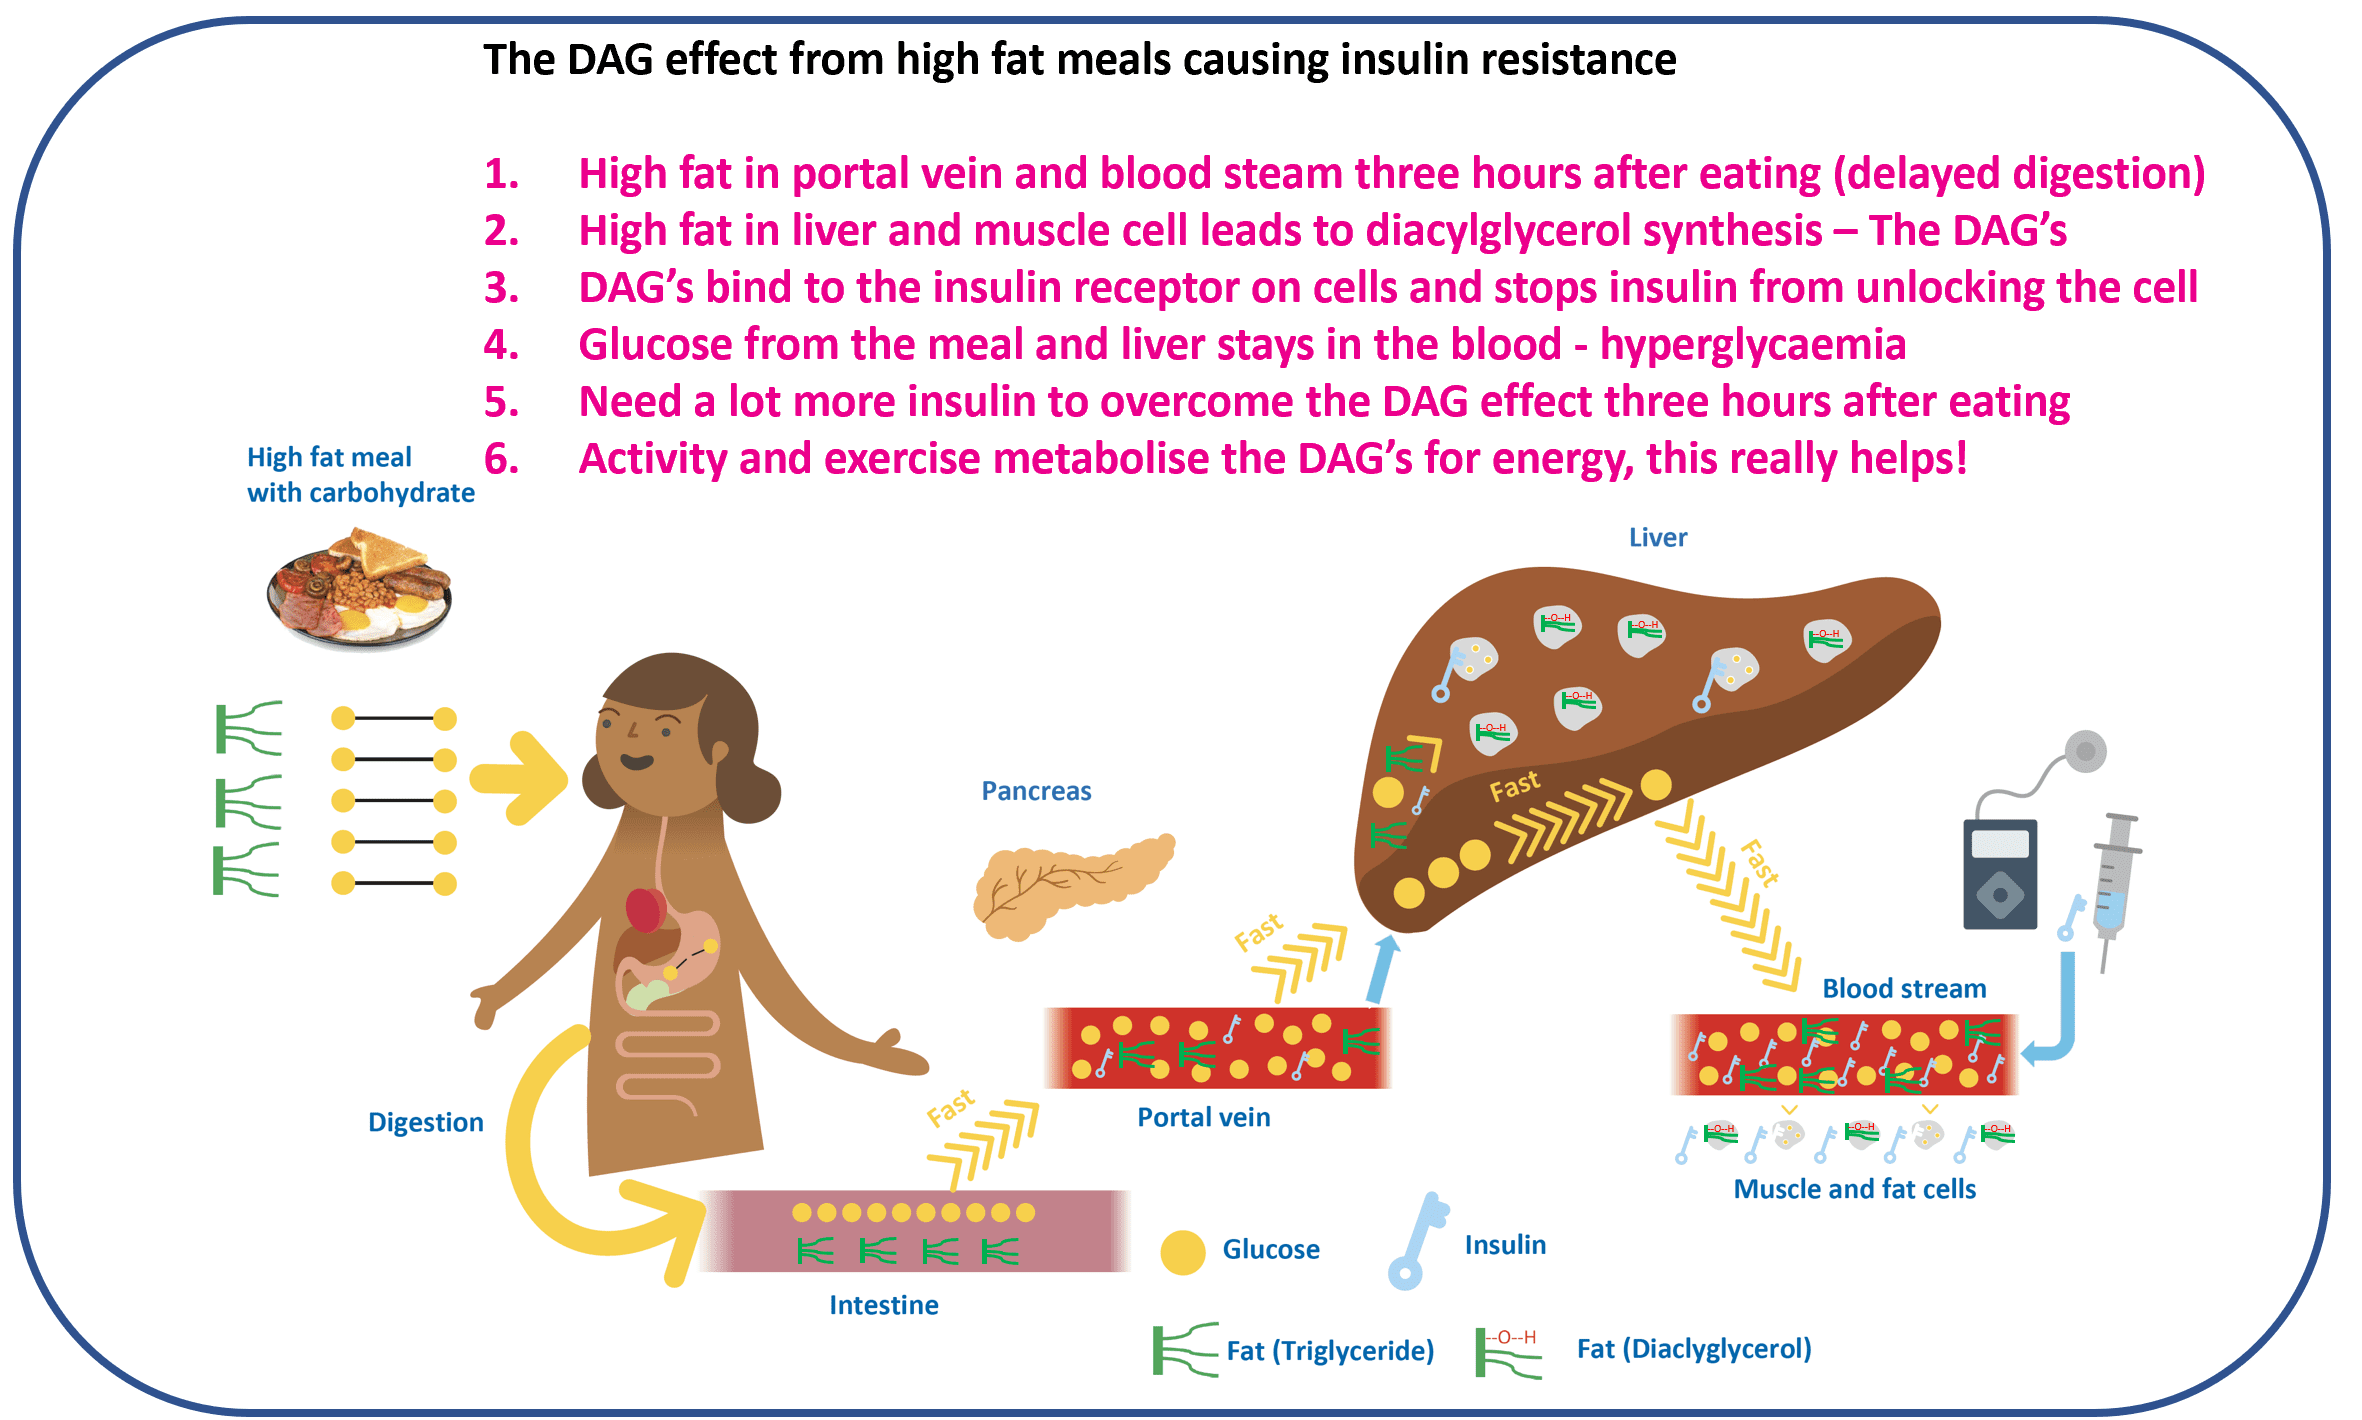
Part 3: High-Fat Meals, How to Conquer Pizza with T1D
Pizza Friday, the cheese-laden lasagne, the takeaway curry. The first hour looks fine, then glucose climbs at hour three and does not come back for hours. The page walks the DAG mechanism (Shulman’s intracellular fat intermediates) and the three response options: split-and-extend the insulin, use activity as an insulin sensitiser, or accept the rise and use GAME.
Mealtime Insulin Guide
Mealtime Insulin: Predictability, not Perfection