
Mealtime Insulin Guide, Part 3 of 3
High-Fat Meals: How to Conquer Pizza with T1D
Pizza Friday lands the same way every time. The first slice is fine. The second slice is fine. The CGM line stays sensible for an hour, maybe two; the kids drift off to a film, the kitchen quietens. Then around hour three the line starts climbing, and the correction you take at hour four does not seem to land cleanly either, and by midnight you are still chasing a number that should have settled long ago. This page names the mechanism, the dose-shape that fits it, and the three response strategies people actually use.
Ask Grace
Want to ask how to size the extra insulin for your usual high-fat meal, or how to read the second-rise on your own CGM? Ask Grace.
What kind of meal lands in this part of the guide
The full English breakfast on a Sunday morning. The thick cheese on toast at 11. The lasagne with garlic bread, the takeaway curry with naan, the fish and chips, the burger and fries, the deep-pan pizza. These are meals where fat does most of the talking. Carbohydrate is still in the meal, but the digestion is slow, the glucose arrival is staggered across hours, and the dose-shape that worked for a bowl of cereal will not keep up with what is coming.
The Mealtime Insulin hub names the mixed-meal pattern the carb ratio was tuned for. High-fat meals sit outside that pattern. The ratio is not broken. The meal has changed.
What the trace looks like
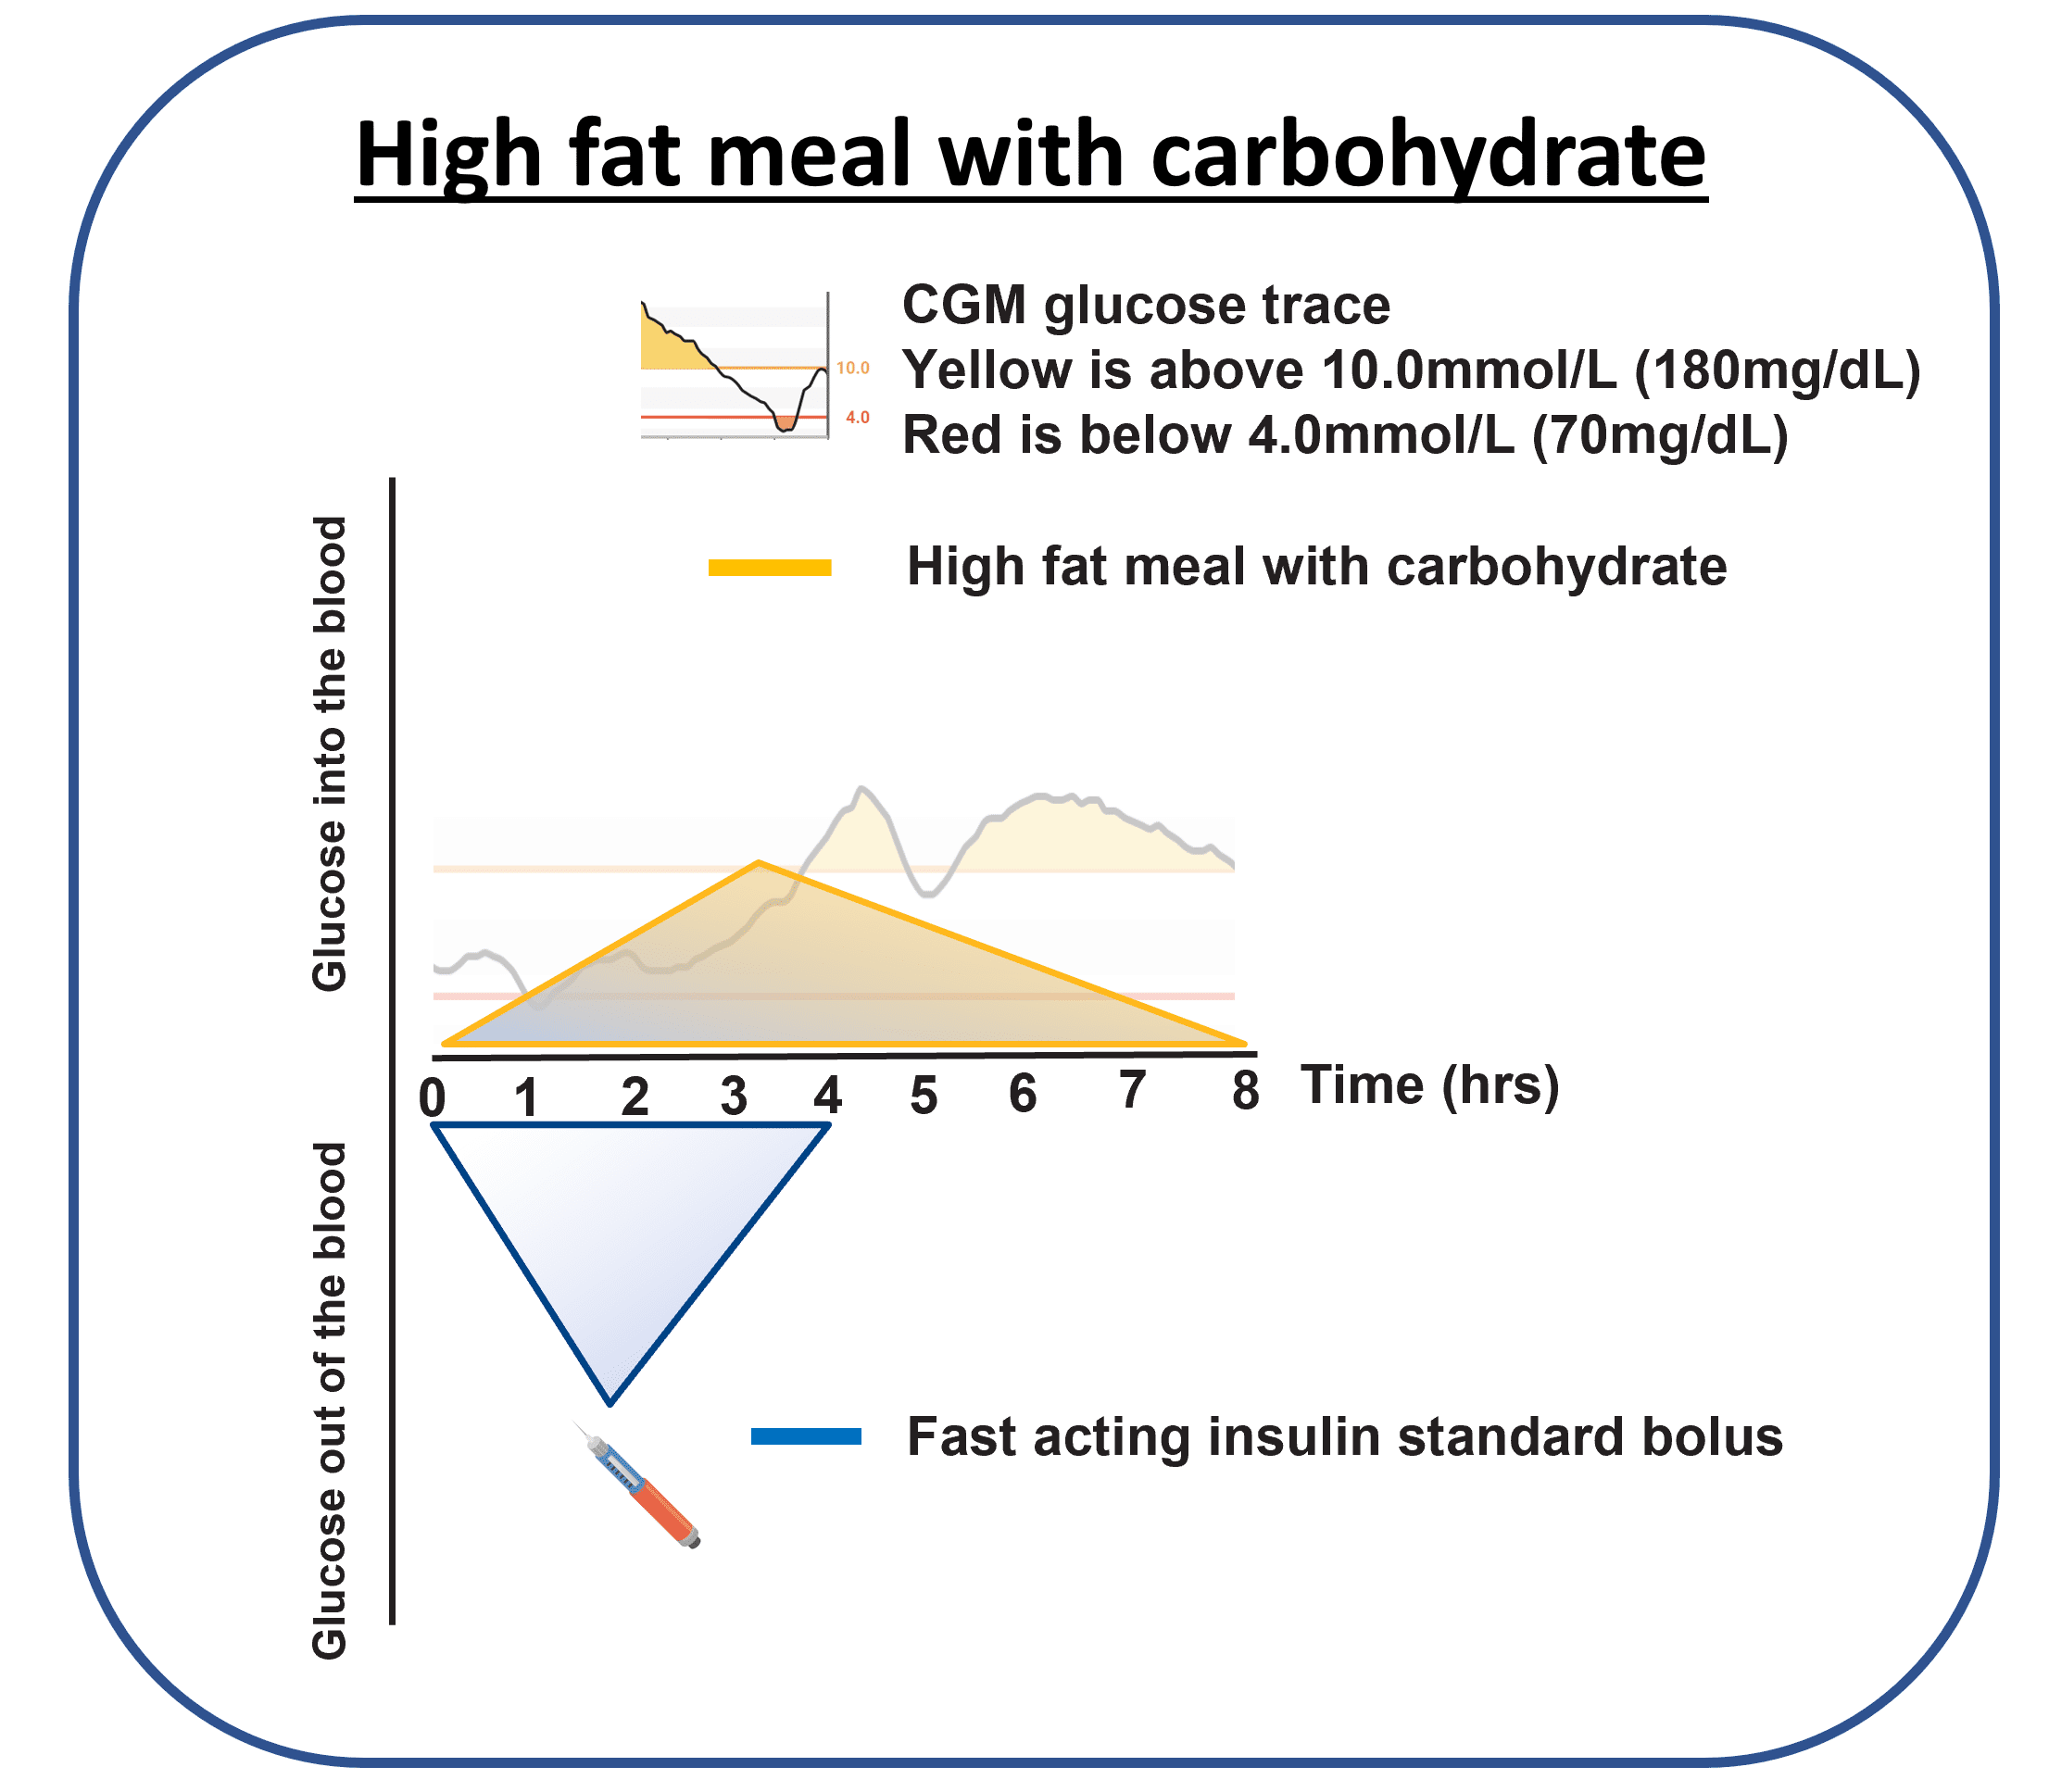
For the first hour or two after a high-fat meal the CGM often looks reassuring. Glucose is steady or only climbing gently. By hour three the line starts to lift, and by hour four to five it can be running well above target with no obvious explanation if the meal has slipped from memory. The classic phrase from the people who have lived it is “it looked sorted, then it climbed”.
Why glucose rises hours later
Two things collide. The first is mechanical, the second is biochemical, and both pull in the same direction.
Fat slows the meal down
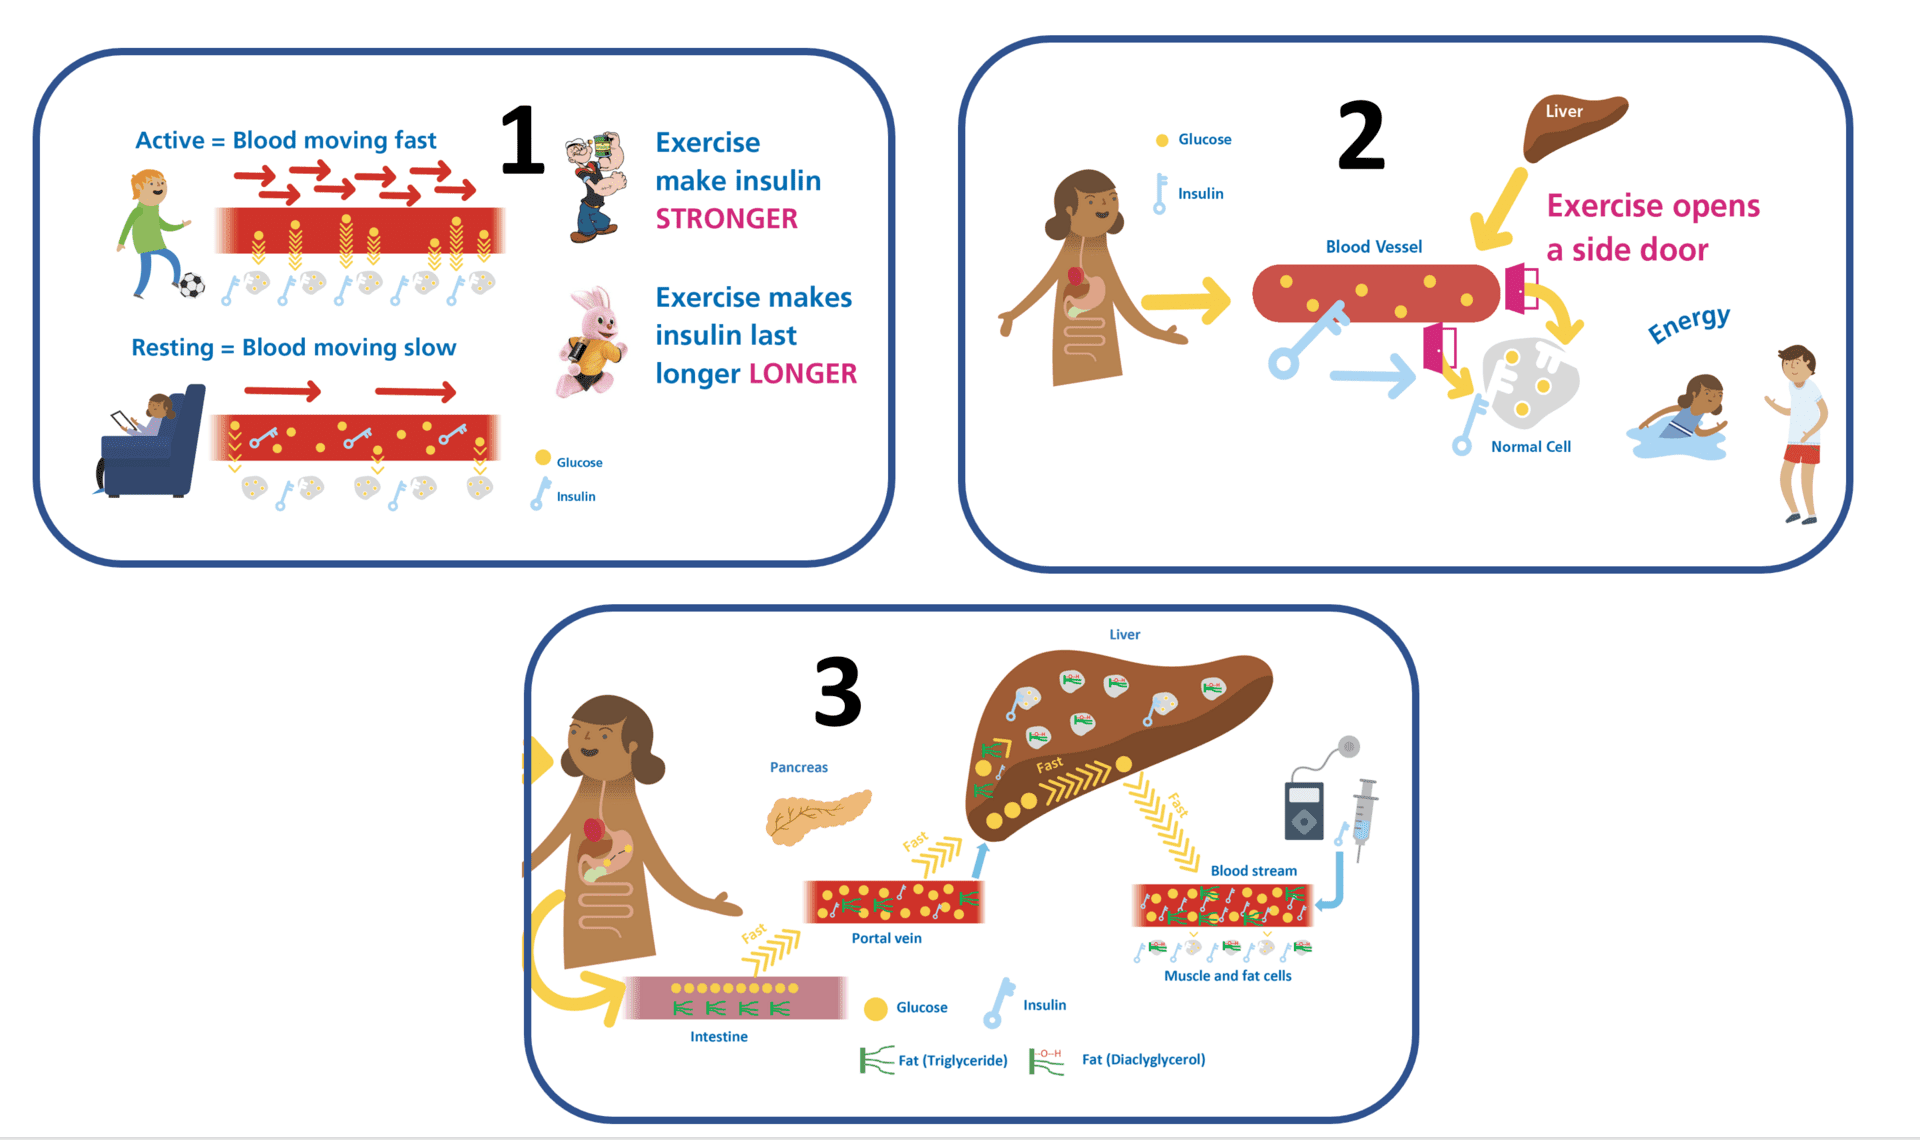
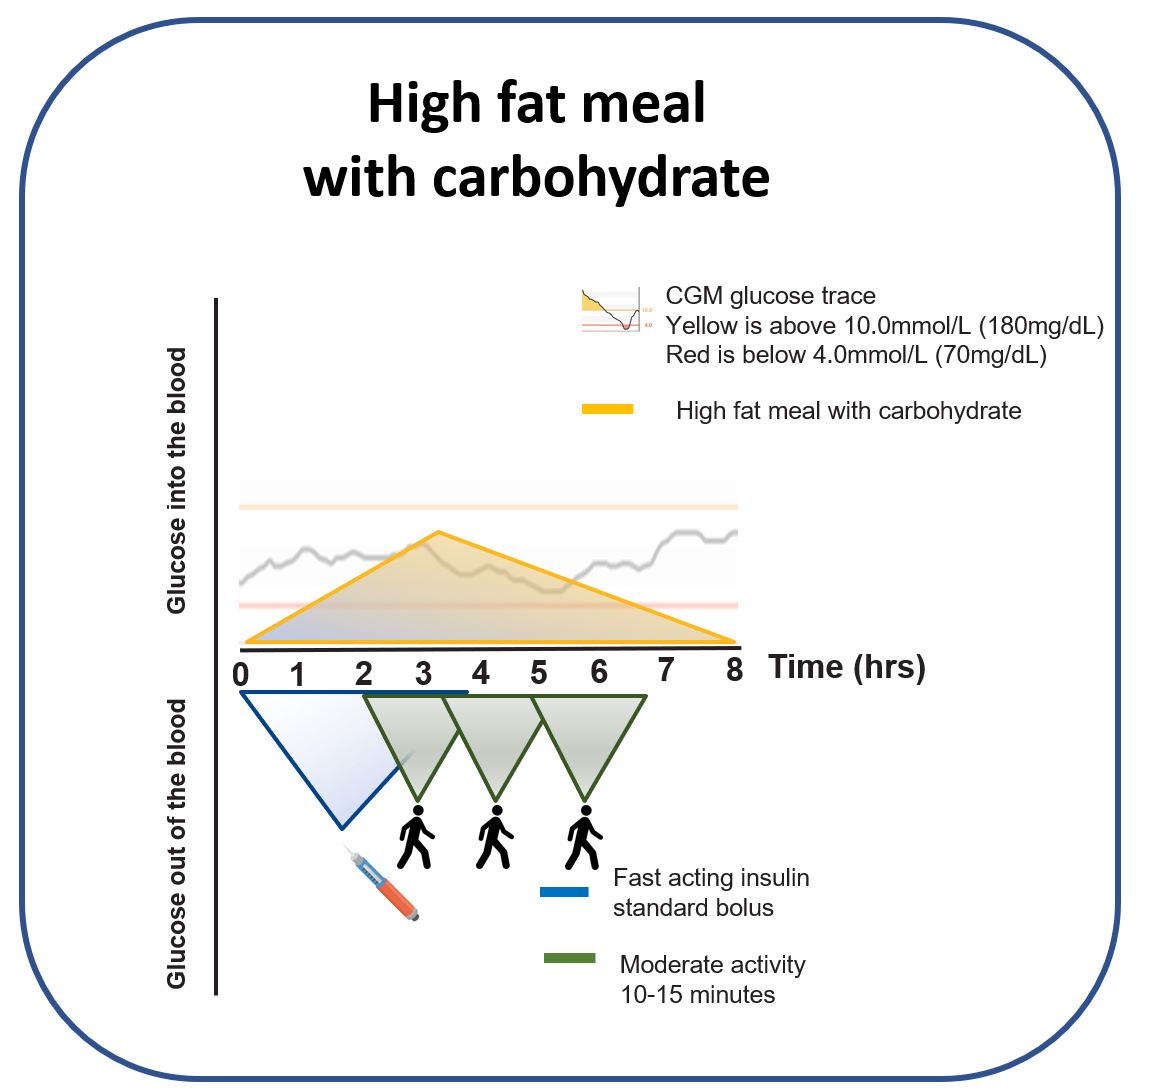
Fat slows gastric emptying. Carbohydrate that would have been absorbed in 60 to 90 minutes after a leaner meal is still arriving in the bloodstream three or four hours after a high-fat one. The same carb count, spread over a longer window, with a single up-front bolus that finished its work two hours ago.
The DAG mechanism, the temporary insulin resistance
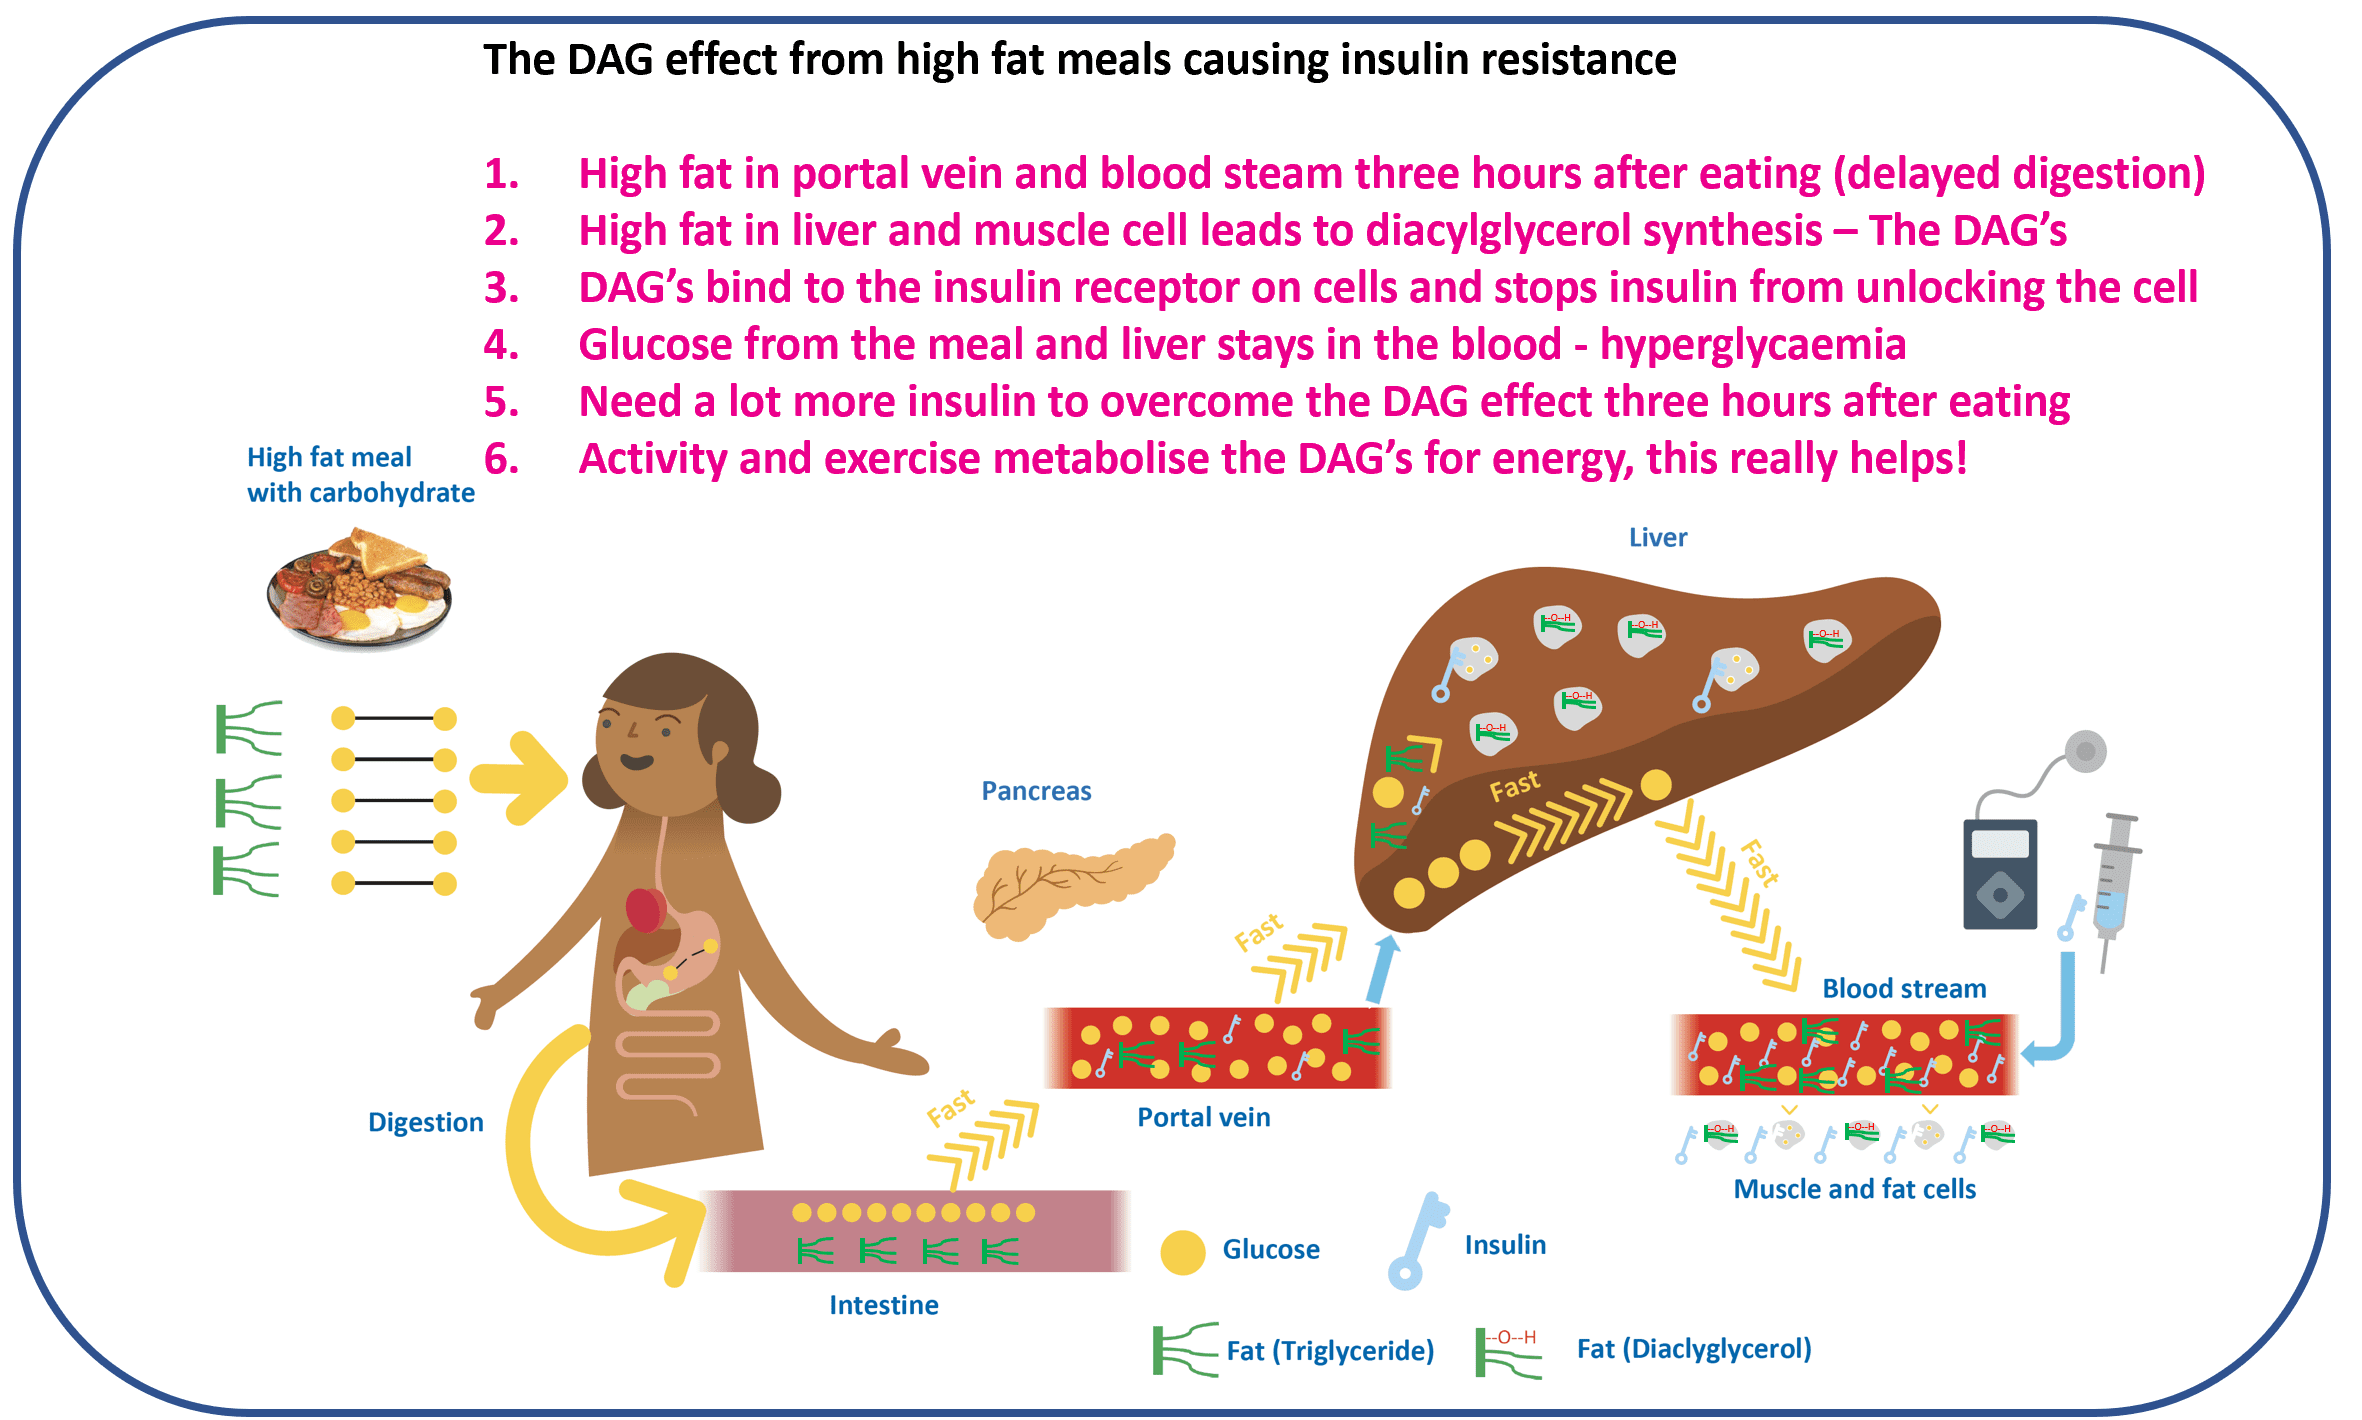
After a high-fat meal, intracellular lipid intermediates (diacylglycerols, or DAGs) accumulate in muscle and liver cells and interfere with insulin signalling for a period of hours (Shulman group, the foundational work). The same dose of insulin produces less effect than it would have done before the fat arrived. For a deep dive into the mechanism, Gerald Shulman on Peter Attia’s podcast is the reference: The Drive episode 140, Gerald Shulman on insulin resistance.
A note on insulin load before adding more insulin
It is possible to brute-force a high-fat meal with a lot of extra insulin every time. The downstream cost is that peripheral insulin levels run higher more of the time, which is not how the body is designed to work; people without diabetes run high insulin in the portal vein, not the systemic circulation. If high-fat meals are a daily pattern, the bigger picture (total daily dose, units per kilogram) is worth tracking alongside time in range. The Measuring success page is the reality check.
Three response strategies people actually use
Three approaches sit alongside each other; most people end up using a mix depending on the meal, the day, and how much attention they have to spend. None is right for every meal; all of them work better when the entry criterion is your own CGM trace, not a recipe in a guide.
Strategy 1, split and extend the insulin
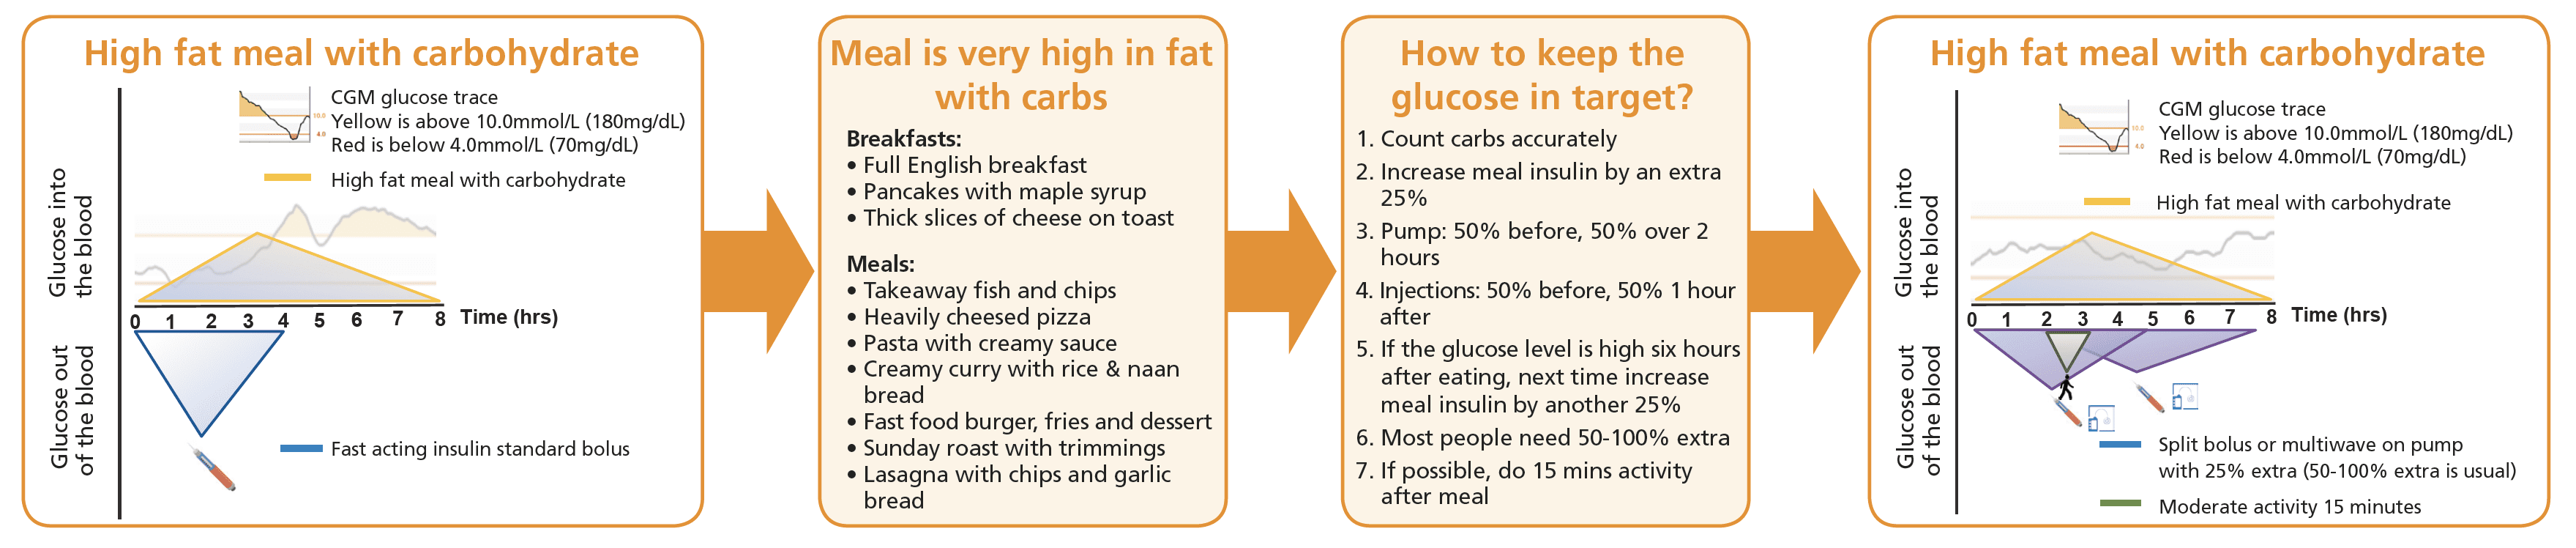
The default response on a pump is a split bolus that puts some insulin up front and the rest extended across two to three hours, matching the dose shape to the meal shape. The starting point from the Pemberton 2021 matrix sits around plus 30 to 35 percent on top of the usual carb-only insulin for a high-fat-and-carb meal, and around plus 50 percent for a high-fat-and-protein-and-carb meal, split roughly 50 percent up front and 50 percent extended over two hours. On injections, the same shape is approximated with a smaller dose at the meal and a top-up around hour two. These are population-average starting points (Wolpert 2013, Bell 2016, with variability minus 17 to plus 124 percent across people); the actual numbers belong to you, your insulin, and conversation with your diabetes care team.
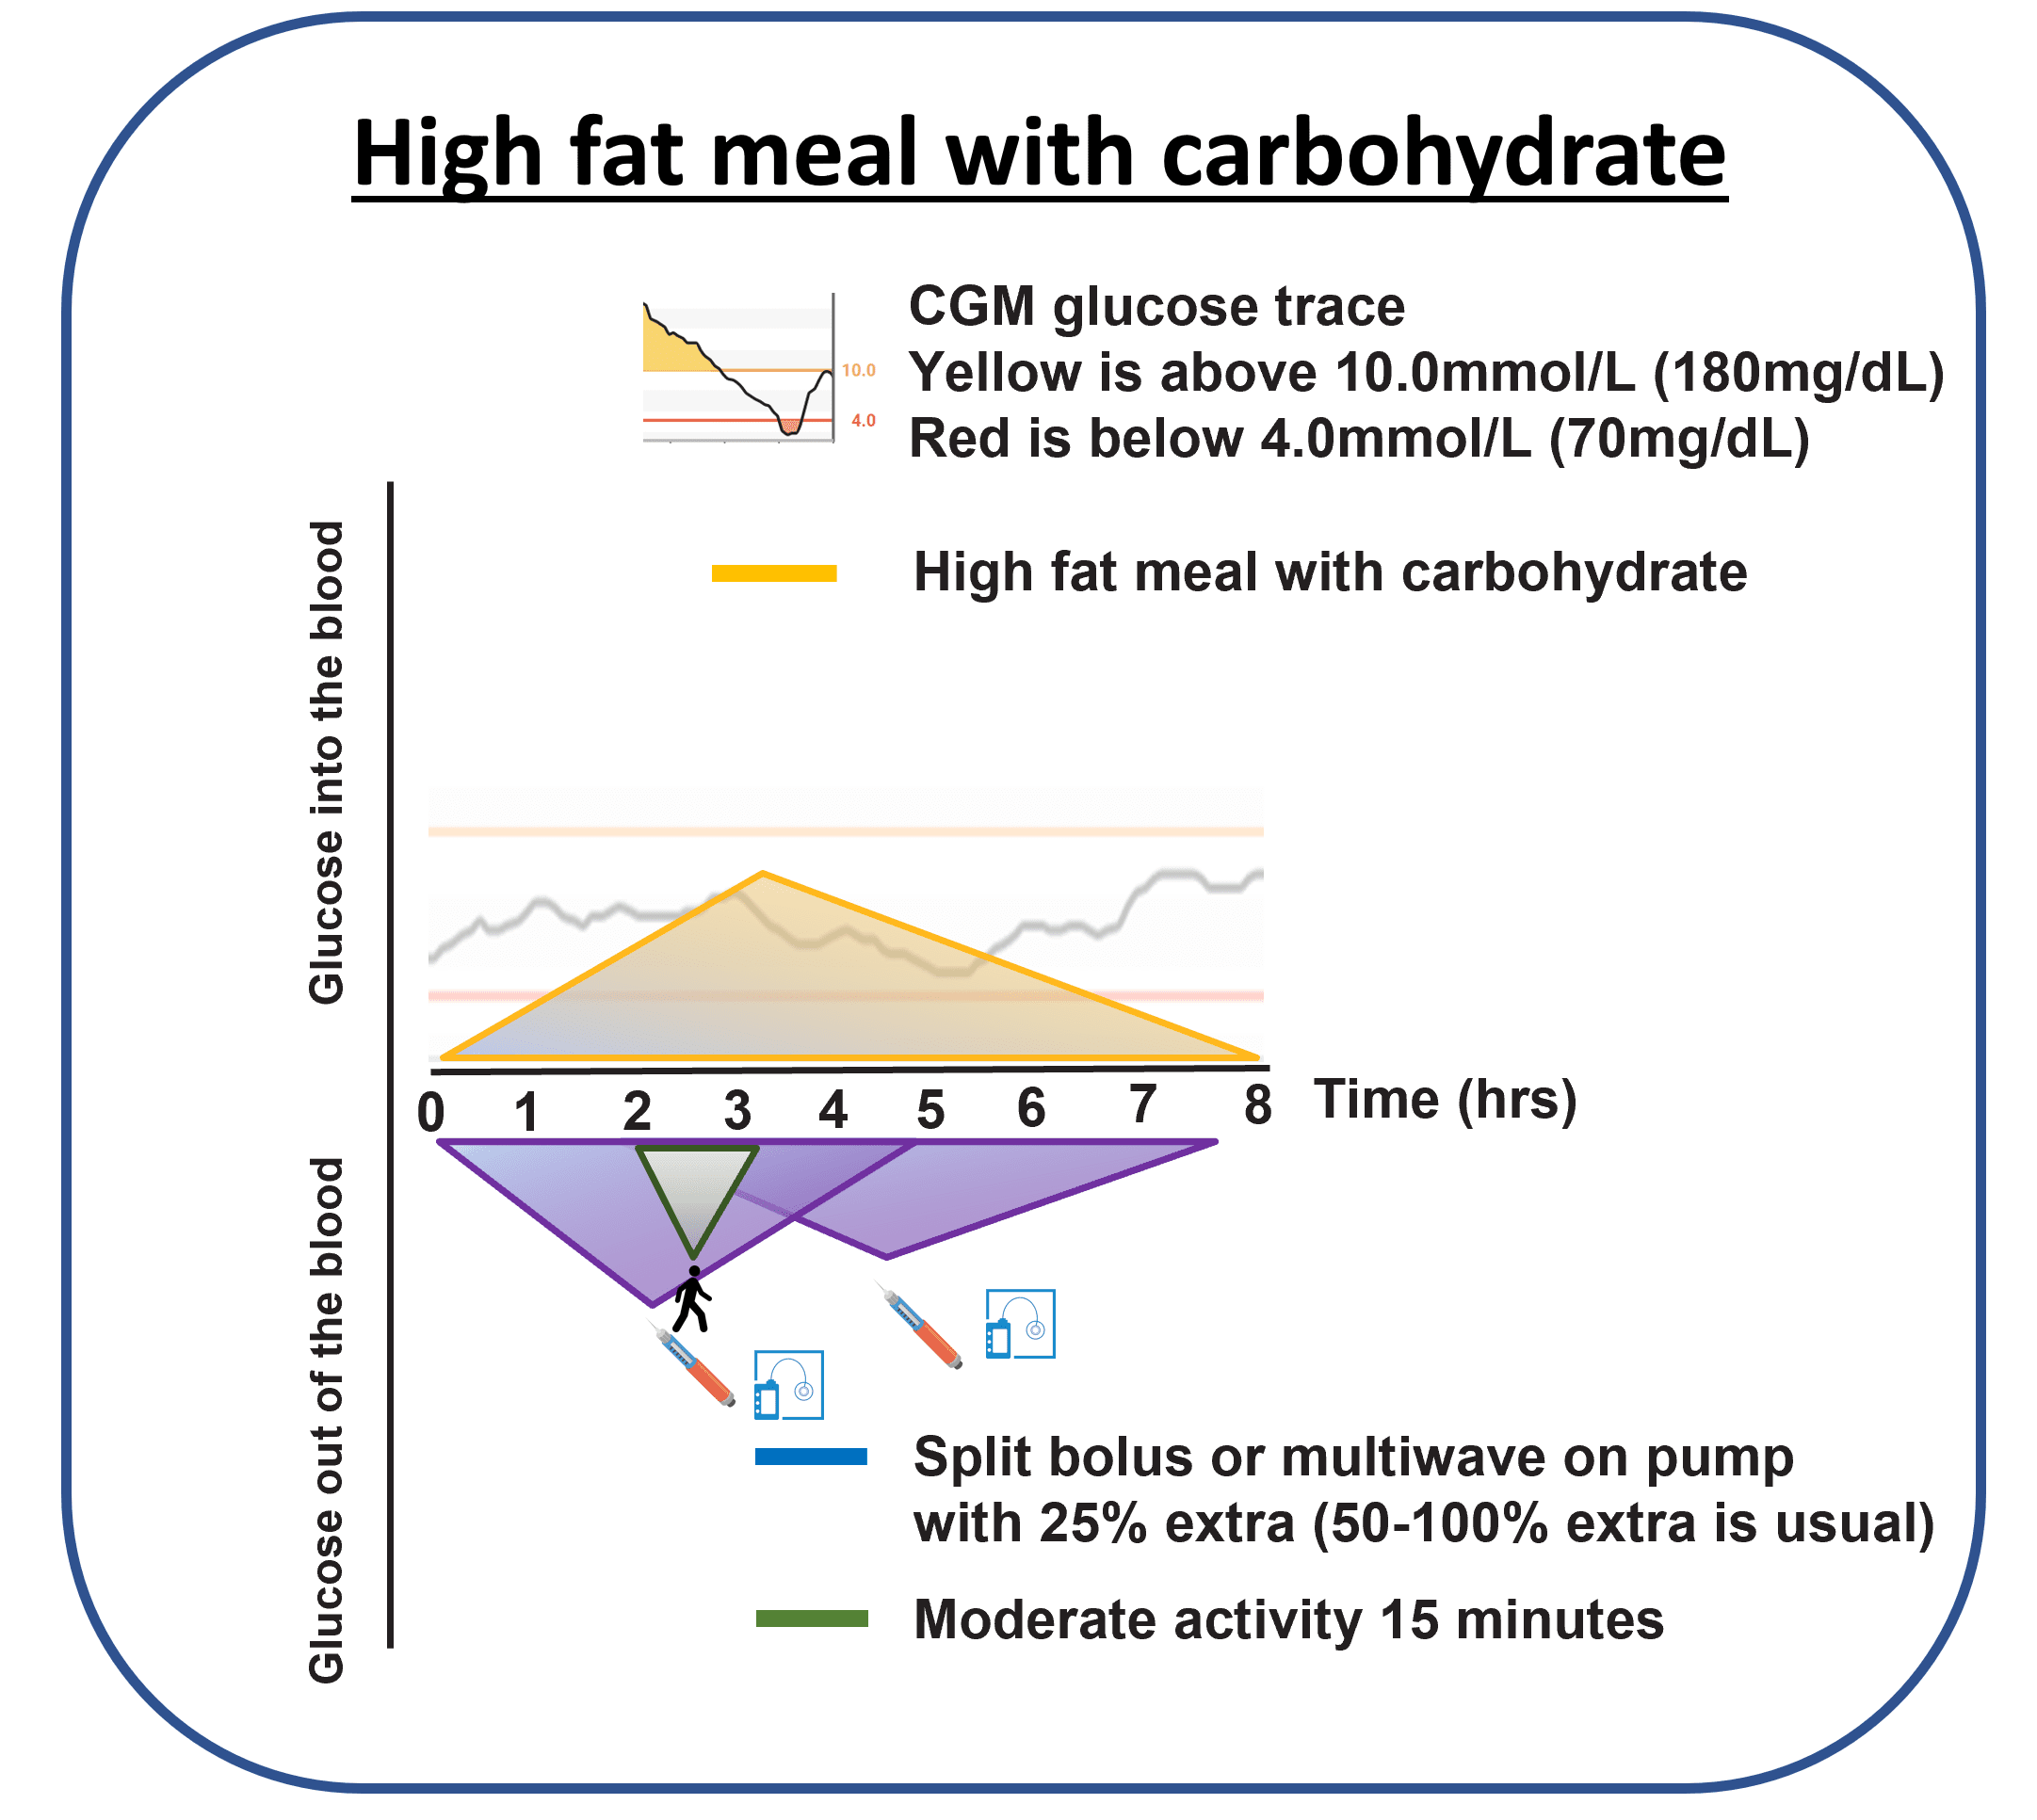
Trying it on a meal you already eat is the cheapest experiment. The CGM is the entry criterion: only adjust the insulin shape on a meal that has already shown the delayed second-rise on a previous trace. The first attempt uses the matrix starting point (plus 25 to 35 percent over carbs to start, split 50/50 over two hours). If glucose is still high six hours after the meal, the next time round the extra insulin moves up another 25 percent of the carb dose. Bring the traces to your diabetes care team if the second attempt still climbs above target; the conversation is then anchored in your data, not in averages.
Strategy 2, use activity as an insulin sensitiser
Around 15 minutes of moderate activity at the two-hour mark works on the second peak through three mechanisms at once. Muscle uptake of glucose increases (and continues for hours after the activity stops). Some of that uptake happens through pathways that do not need insulin to work, which sidesteps the temporary DAG resistance entirely. And the muscle burns through some of the intracellular DAG itself, which restores normal insulin signalling earlier than it would have done with rest. The combined effect is often visible on the next CGM trace.
The Activity Snacking podcast walks the practical end of this in detail.
Strategy 3, accept the rise, then use GAME
Some meals on some evenings, the dose-shape work and the post-meal walk are both more attention than is on offer. The third strategy is to accept the second peak will happen, set the high alarm on the CGM, and use the GAME framework to correct the rise once without stacking three corrections on top of each other. GAME is the structural answer to the late-rising high-fat meal that did not get an extended bolus; it is not the workhorse strategy, but it is the safety net.
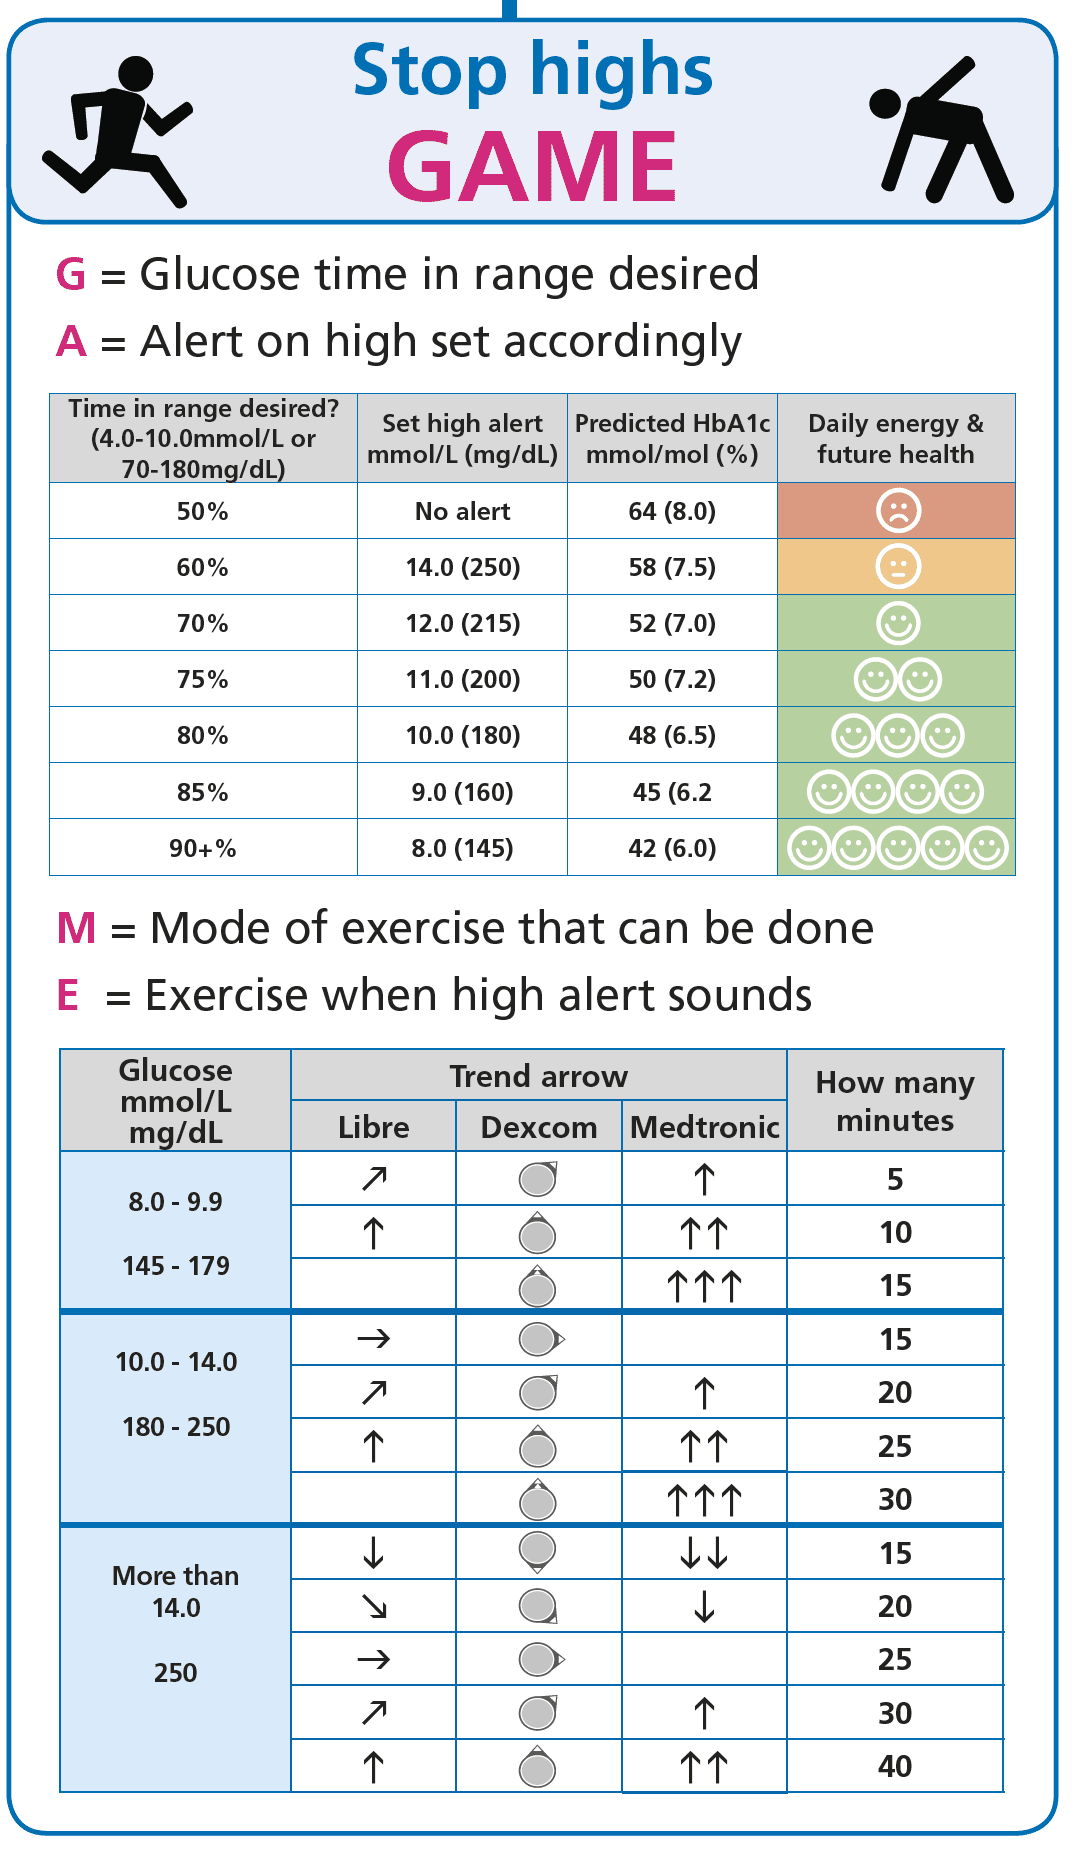
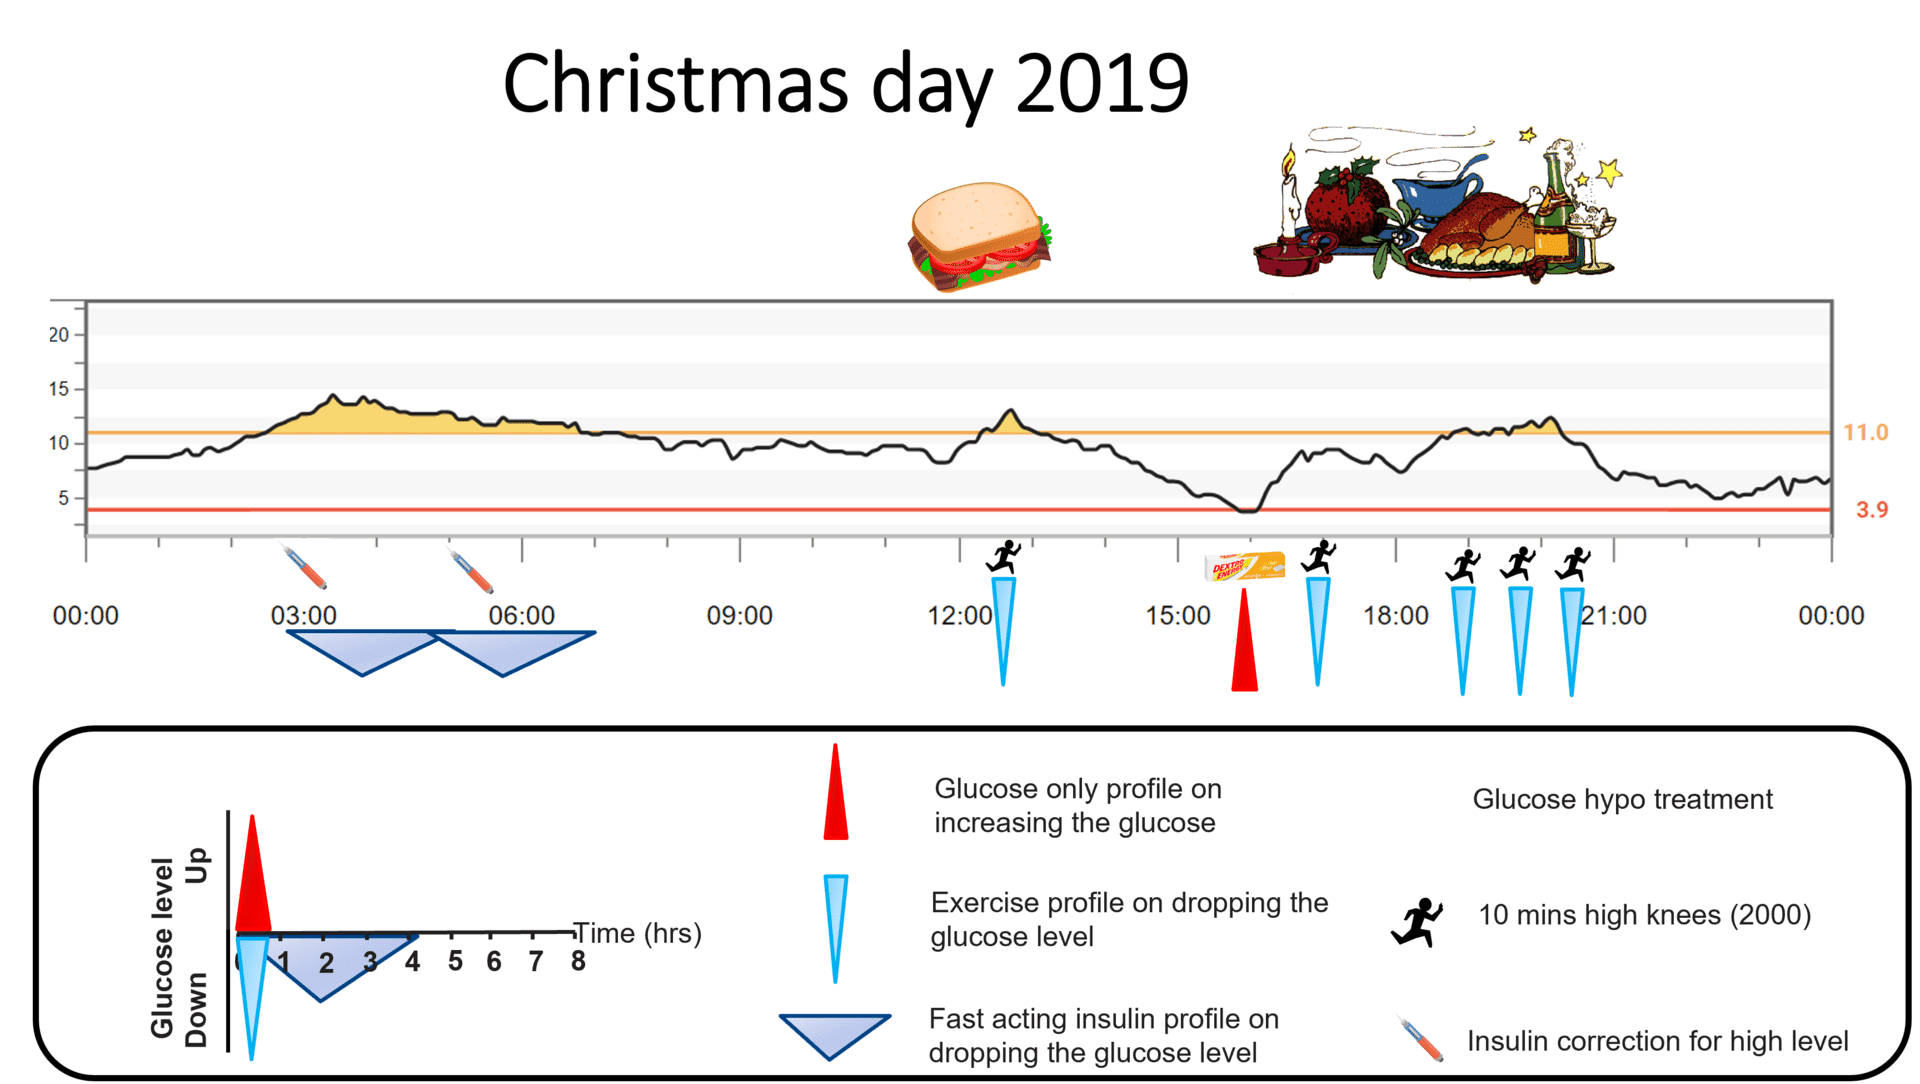
The high-fat meal is a dose-shape problem, not a willpower problem. Fat slows the meal down and the DAG mechanism temporarily blunts insulin signalling, so a single up-front bolus matched to the carb count finishes its work before the second peak arrives. A split bolus that puts roughly half the (slightly larger) dose up front and the rest extended over two to three hours matches the meal shape; a short walk around the two-hour mark stacks on top through three different mechanisms; and if neither move is on offer, GAME is the structured correction that avoids stacking. None of this is “take X units”; it is a percentage adjustment against the ratio you and your diabetes care team set.
This content is for educational exploration only. The percentages above are population-average starting points (Pemberton 2021 matrix, with variability minus 17 to plus 124 percent across people in Wolpert 2013 and Bell 2016). Refine with CGM and your diabetes care team, who hold your individual ratio and correction factor.
Trying it on a meal you already eat
Pick a high-fat meal that already shows the late second-rise on your CGM (the Friday pizza, the Sunday Indian takeaway, the lasagne that always seems to need a midnight correction). Run it twice across the next two months, not in the same week. The first time, watch the trace and write down where the second peak lands. The second time, apply one of the three strategies above (split-and-extend with the matrix starting points; or the same dose plus a 15-minute walk at hour two; or GAME with the high alarm set). Watch the second trace. The CGM is the entry criterion and the answer; the glucose never lies. Bring both traces to your diabetes care team if the second one still climbs.
References
Pemberton 2021, Mealtime Insulin Guide (the 130 percent ICR insight, dosing matrix)
Pemberton J, et al. The Glucose Never Lies Mealtime Insulin Guide for type 1 diabetes. Pediatric Diabetes. 2021. COI flag: John Pemberton is lead author. Anchors the matrix percentages above for high-fat-and-carb (~+30 to +35 percent) and high-fat-and-protein-and-carb (~+50 percent) meals.
Wolpert 2013, dietary fat acutely increases glucose and insulin requirements
Wolpert HA, et al. Dietary fat acutely increases glucose concentrations and insulin requirements in patients with type 1 diabetes. Diabetes Care. 2013. The clamp study that quantifies the high-fat insulin requirement and reports the wide between-person variability.
Bell 2016, optimised mealtime insulin dosing for fat and protein
Bell KJ, et al. Optimised mealtime insulin dosing for fat and protein in type 1 diabetes. Diabetologia. 2016. The randomised crossover that anchors the split-bolus dose-shape recommendations and the +0 to +124 percent variability range.
Shulman group, intracellular DAG and insulin signalling
Shulman GI, and colleagues. The intracellular diacylglycerol (DAG) and PKC mechanism behind acute insulin resistance after high-fat meals. Foundational mechanistic work spanning multiple Cell Metabolism and Journal of Clinical Investigation papers. Lay-accessible summary on Peter Attia’s Drive episode 140.
Part 3 of 3
High-Fat Meals: How to Conquer Pizza with T1D
Test your knowledge
You have finished the guide. Score 9 out of 10 or more for a certificate.
Ten questions, drawn at random, on the hub page.