Foundations – Part 2
CGM Basics
Continuous glucose monitoring turns glucose from an occasional spot-check into a continuous signal. Understanding how it works, and what it can and cannot tell you, underpins everything else in this guide.
Ask Grace
Want to ask about CGM accuracy, trend arrows, or which sensor fits your day? Ask Grace.
CGM glucose vs finger-prick glucose
CGM sensors read glucose from interstitial fluid – the fluid surrounding cells just beneath the skin. Finger-prick meters read glucose directly from capillary blood. These are different compartments, which is why the two readings will never match perfectly.
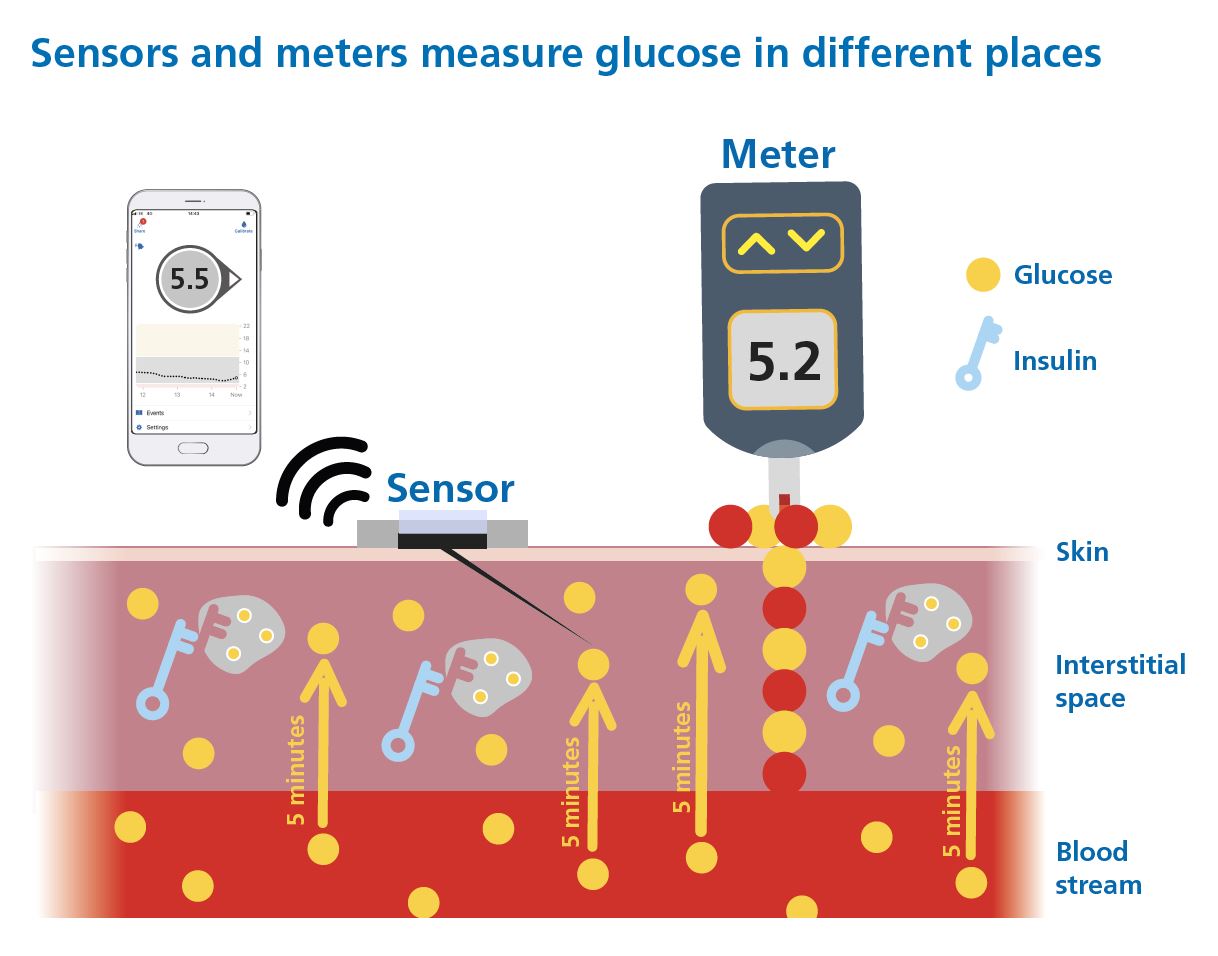
Key things to understand:
- The CGM reading is usually around 5 – 10 minutes behind blood glucose, so the two will never match exactly – especially when glucose is moving quickly.
- If in doubt, use a finger-prick blood glucose meter to confirm.
- Always keep an ISO-standard meter available with in-date strips and use good testing technique.
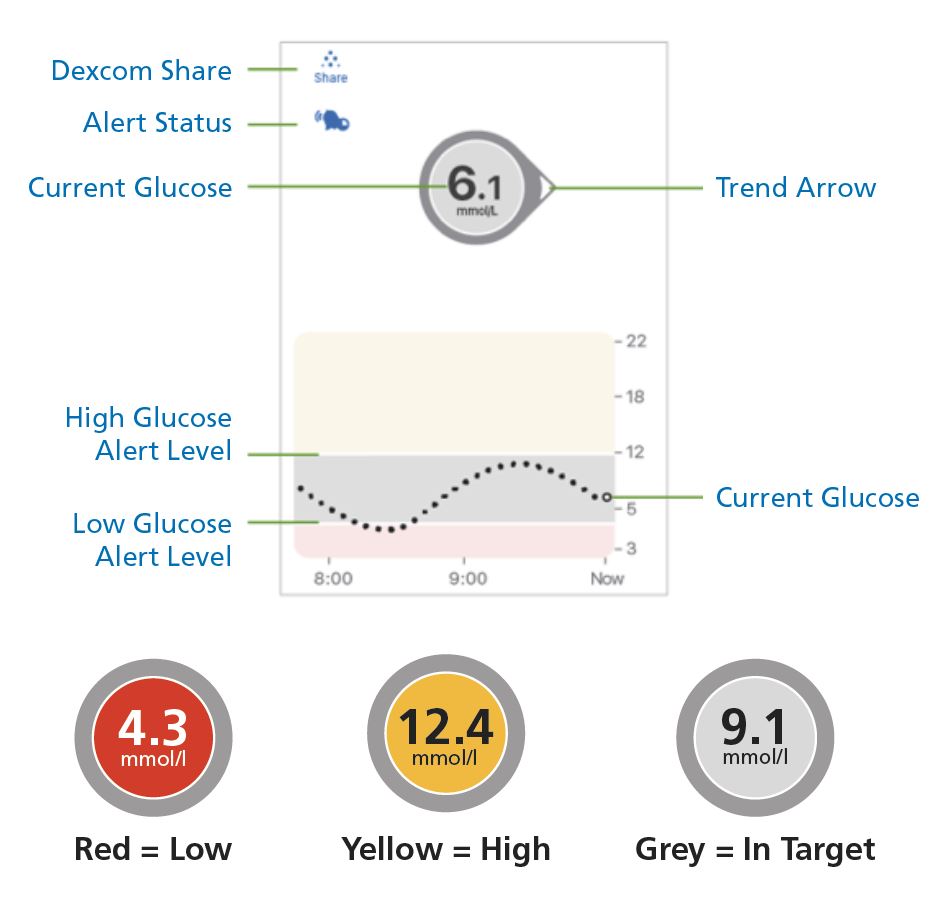
- CGM updates every 5 minutes, creating a continuous feedback loop rather than a snapshot.
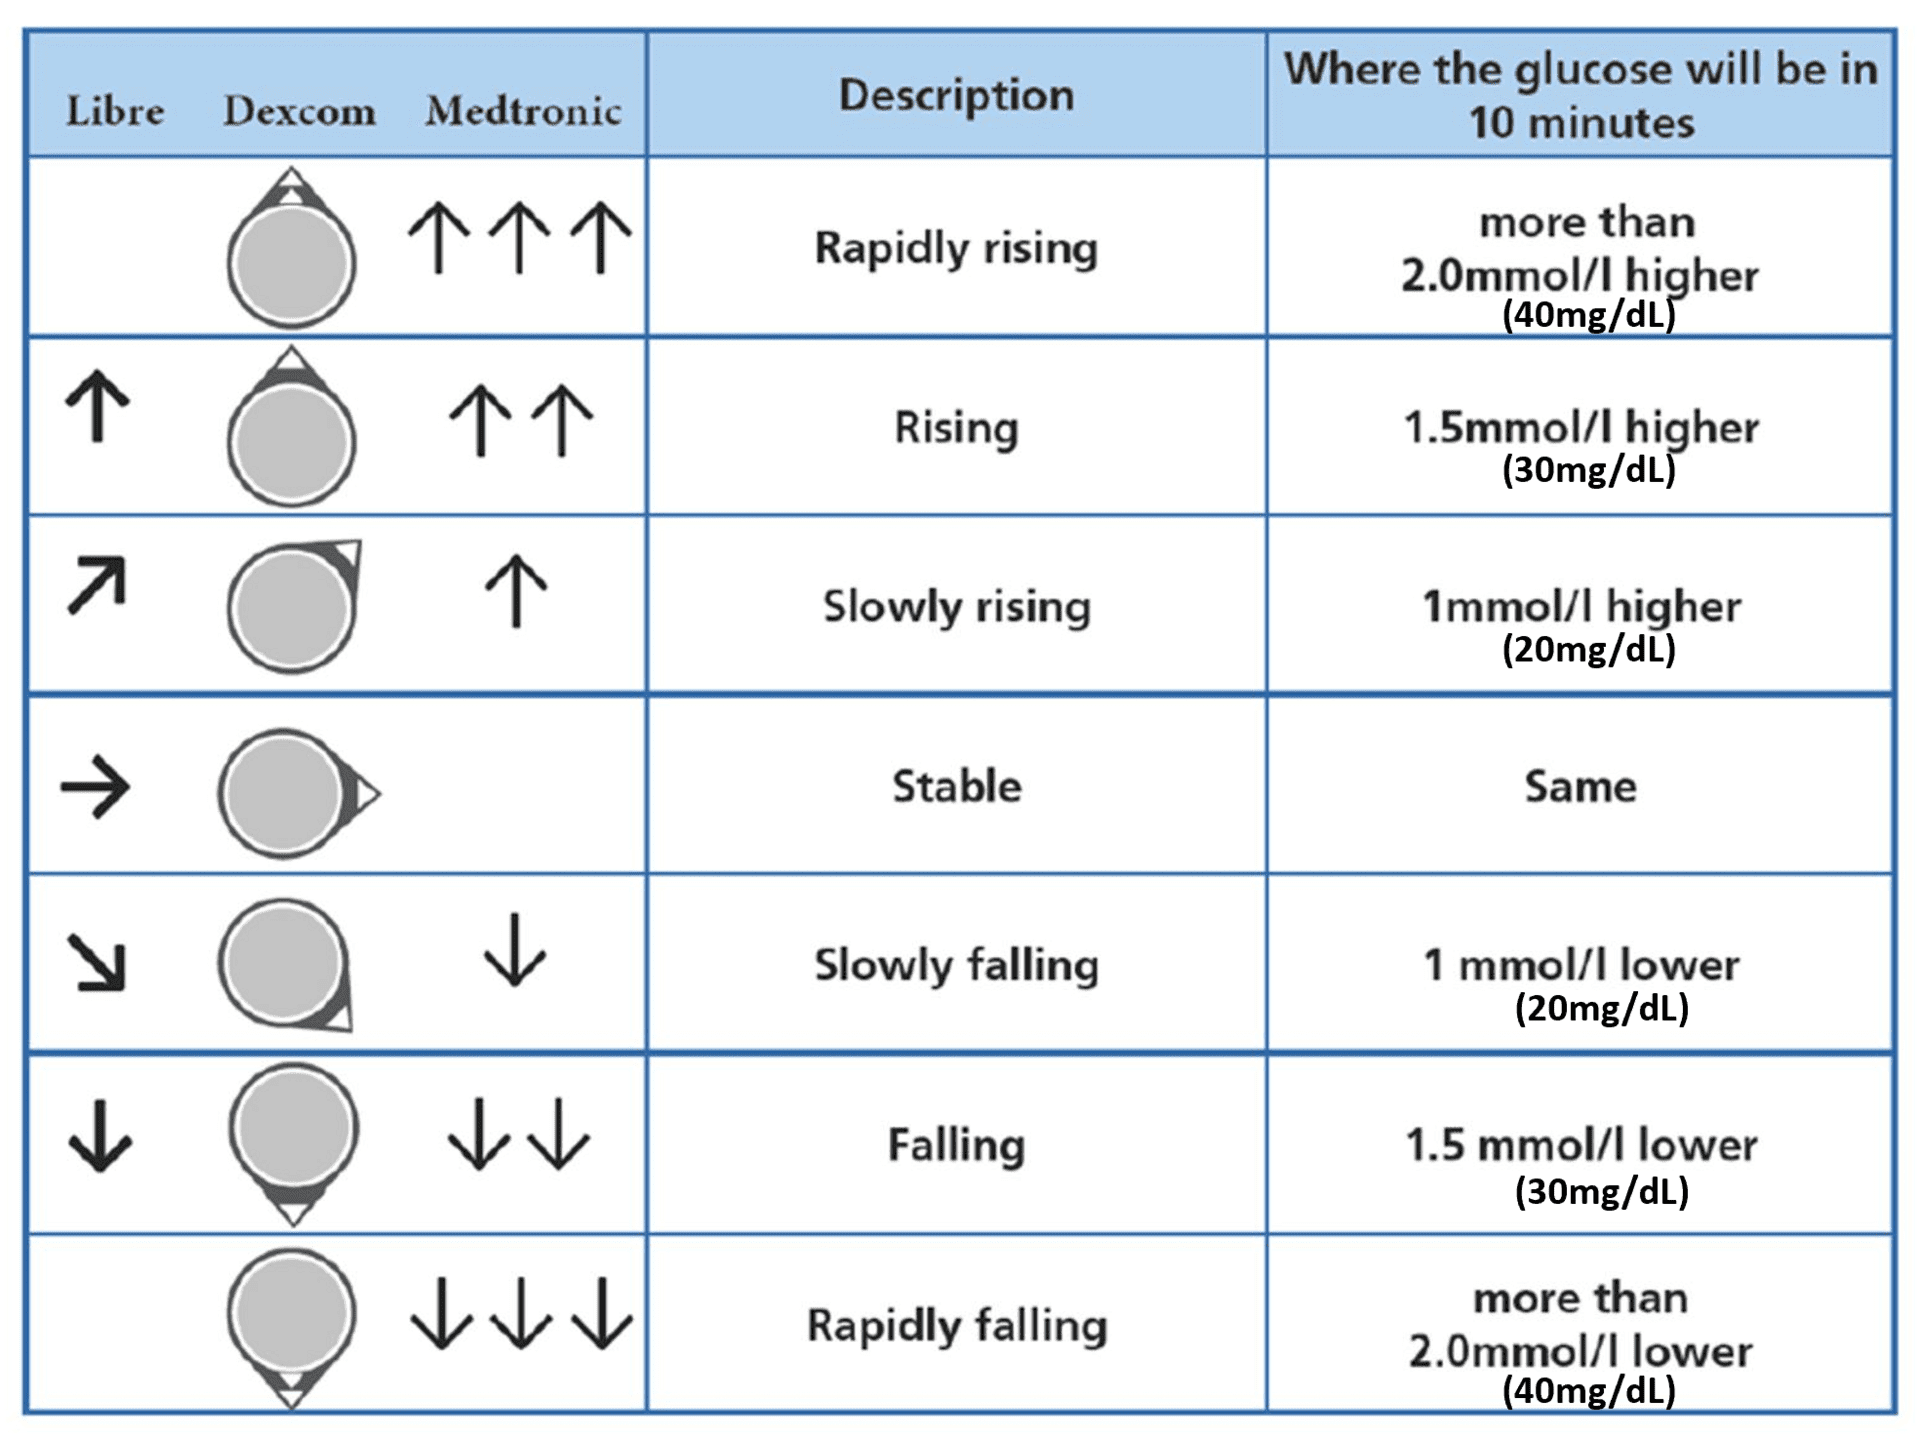
- Trend arrows show where glucose is heading. Each CGM has its own arrow system, but they all communicate the same idea: roughly where glucose is likely to be in the next 10 – 20 minutes.
If you use mg/dL, keep this conversion in mind: 1.0 mmol/L ≈ 18 mg/dL. Quick reference:
- 2.0 mmol/L ≈ 36 mg/dL
- 1.5 mmol/L ≈ 27 mg/dL
- 1.0 mmol/L ≈ 18 mg/dL
How accurate are CGM devices today?
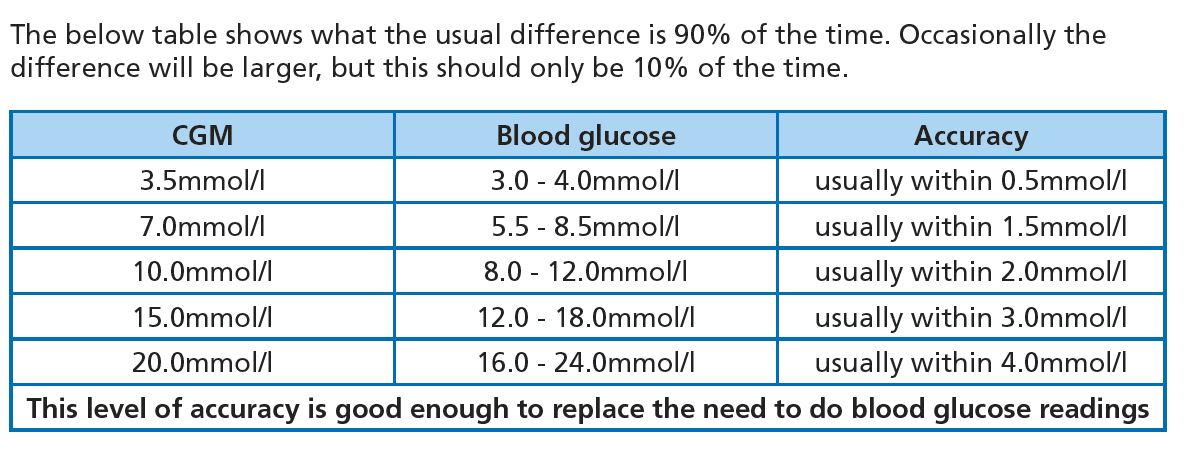
With a well-chosen CGM, around 90% of readings tend to be highly accurate, around 9% are accurate enough for routine use, and about 1% are wrong.
That 1% is why a high-quality, ISO-standard finger-prick meter should always be available.
If the number on the screen doesn’t match how you feel – if something seems off or doubt creeps in – don’t argue with your body. Confirm it with a finger-prick.
When in doubt, get the blood glucose meter out.
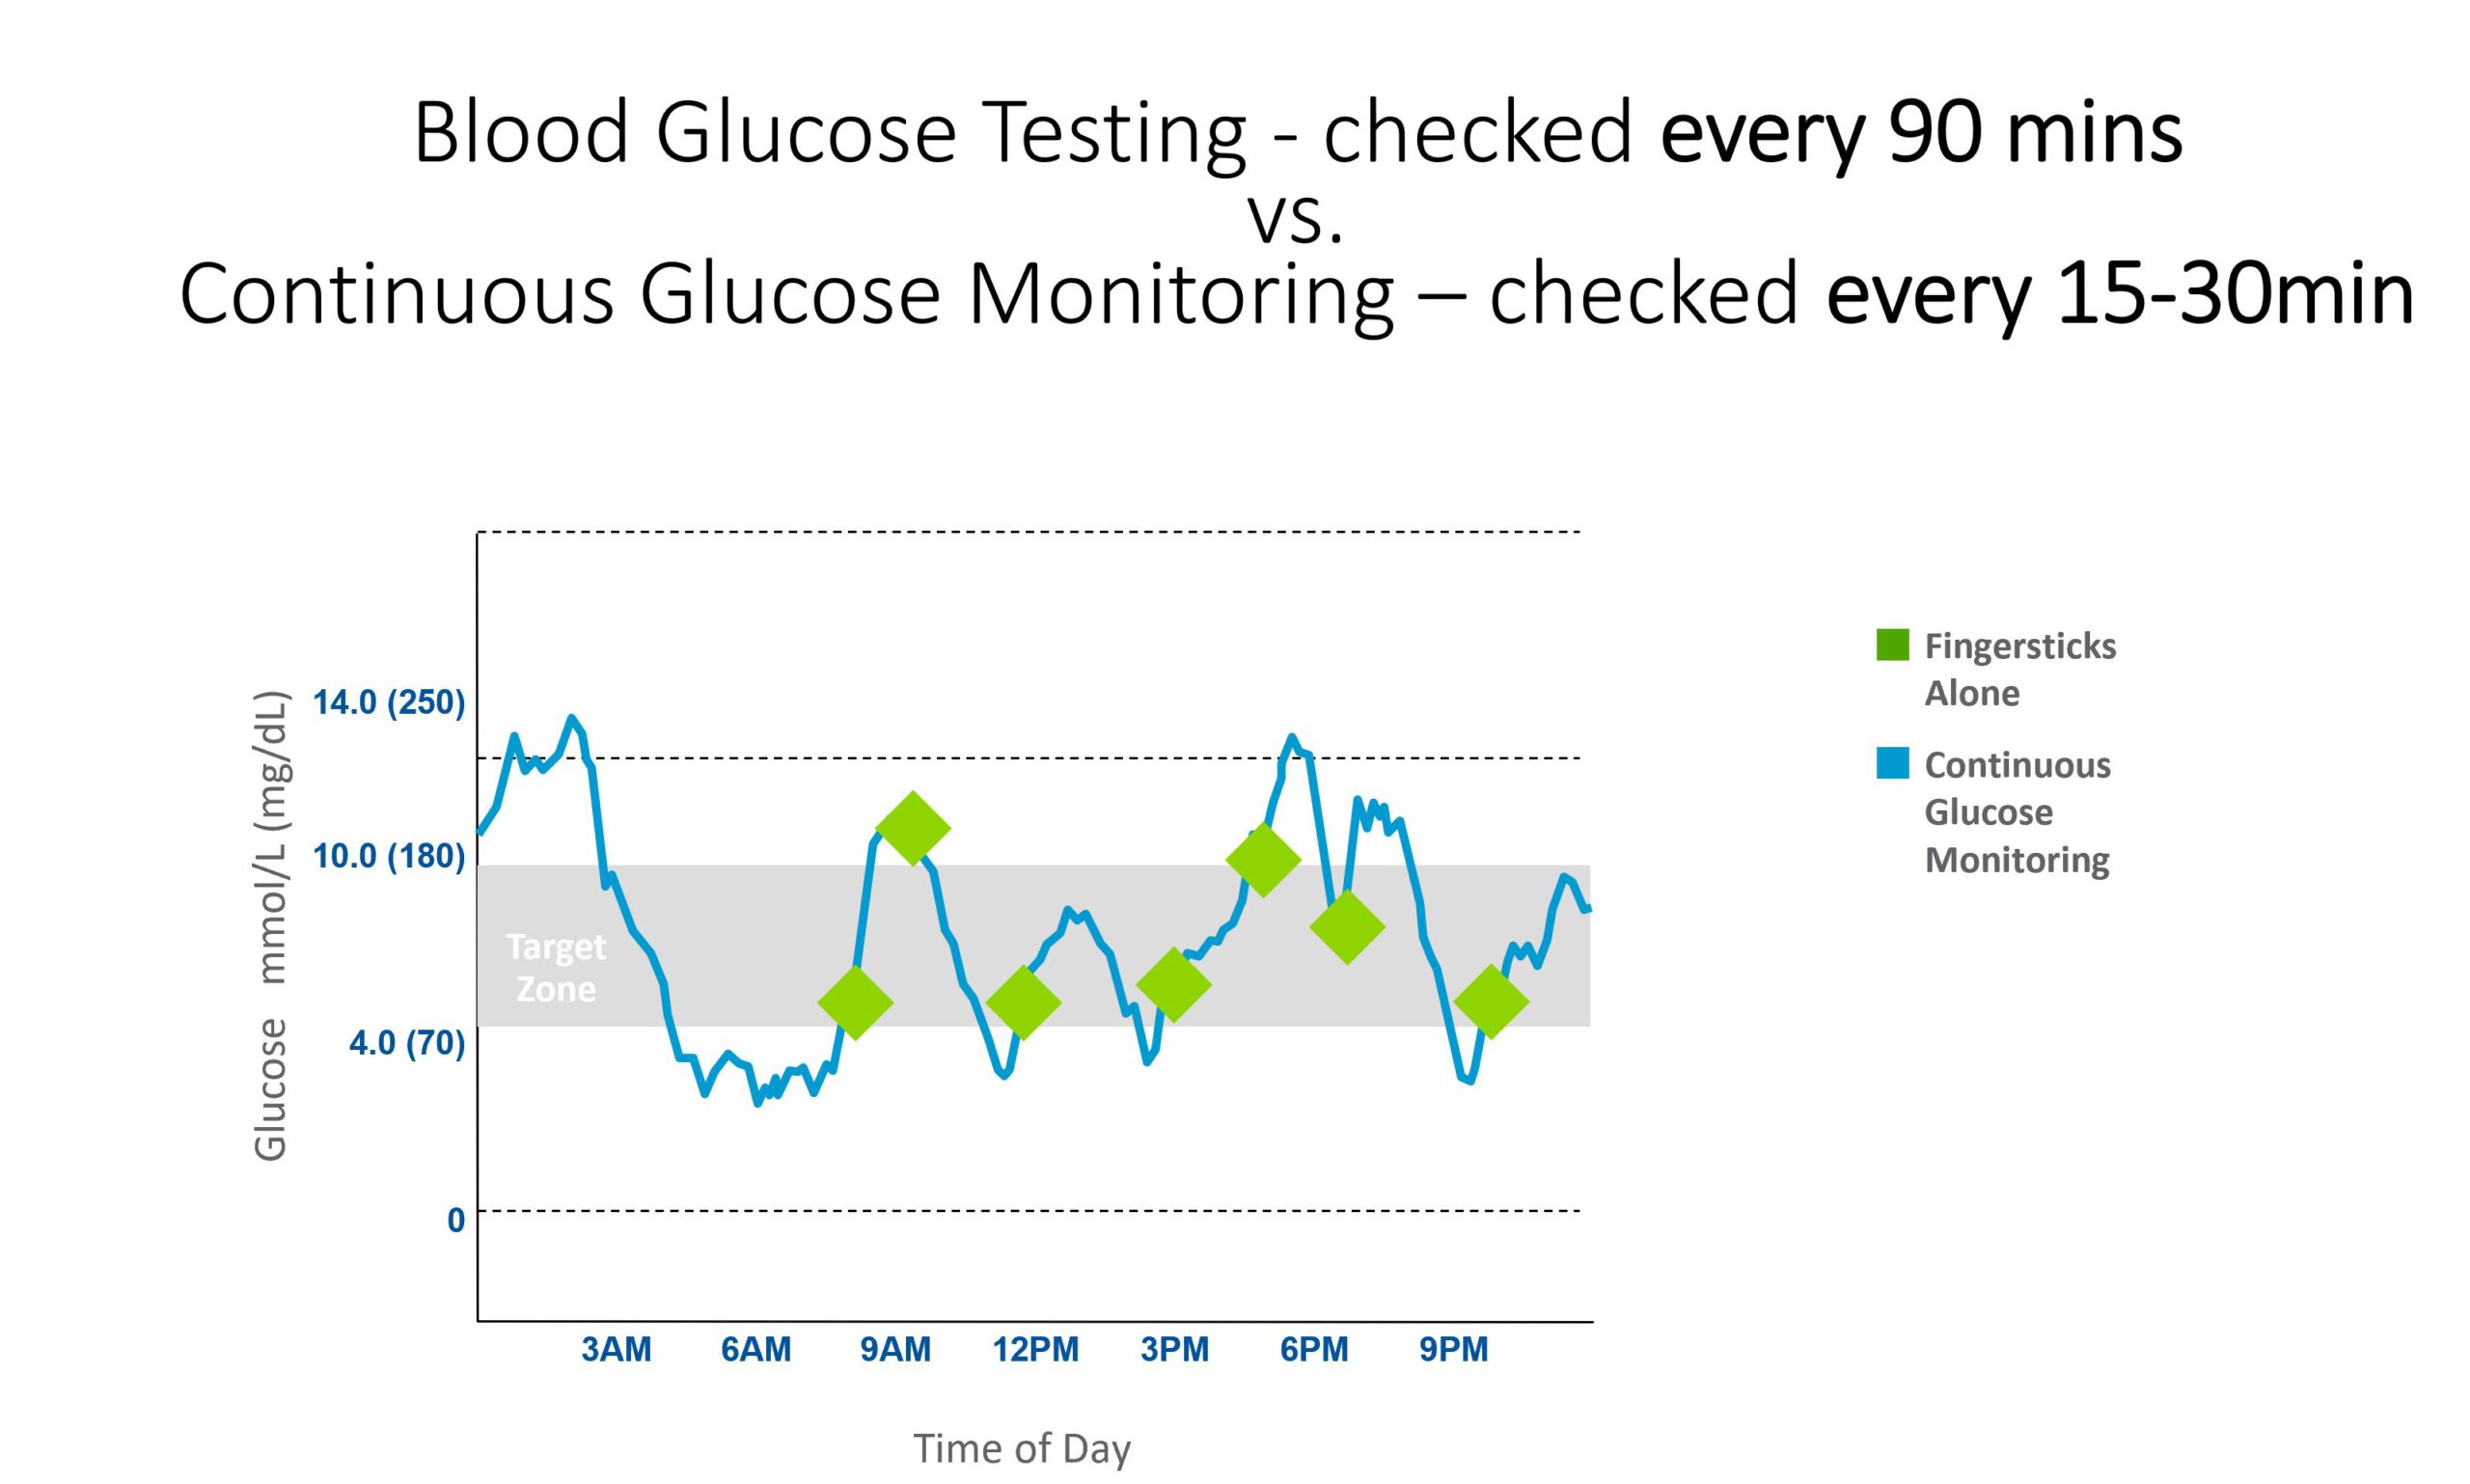
Why CGM tends to be so much better than finger pricks
There are three main reasons CGM tends to outperform intermittent finger-prick testing for day-to-day glucose management:
1. More feedback means faster learning
More data points means quicker cause-and-effect learning. You can see what a meal, a walk, a stressful meeting, or a late night actually does to your glucose – not just infer it from an occasional snapshot.
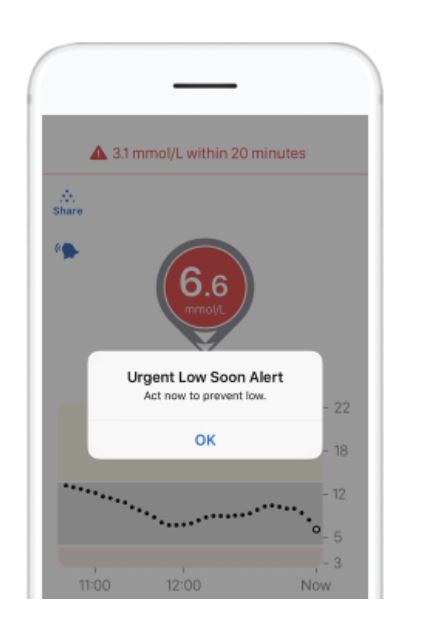
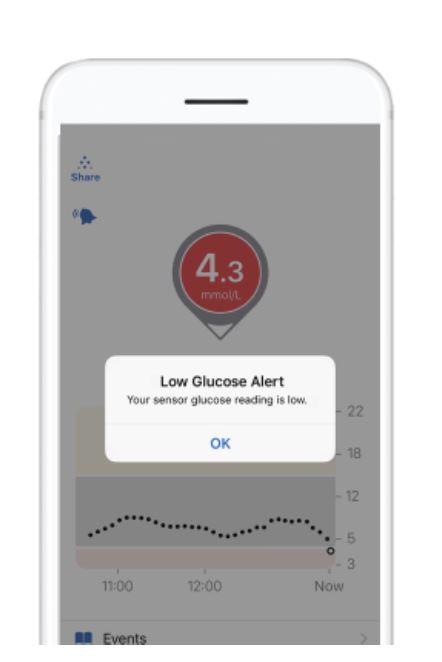
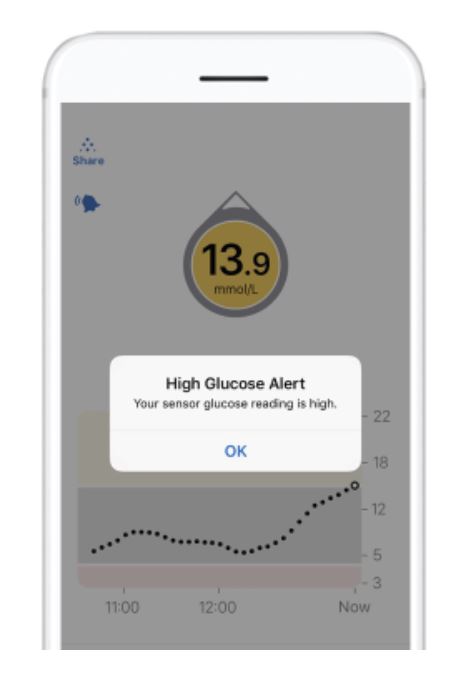
2. Alerts reduce surprises
High and low alarms act like barriers at a bowling alley – they help stop you falling off the edge. Getting an alert before a low becomes a symptomatic hypo is a genuinely different experience from only knowing about it after the fact.
3. Trend arrows let you act earlier
Trend arrows help you anticipate what’s coming and use Dynamic Glucose Management to stay on target. Knowing glucose is falling at speed is very different from seeing a static number at a moment in time.
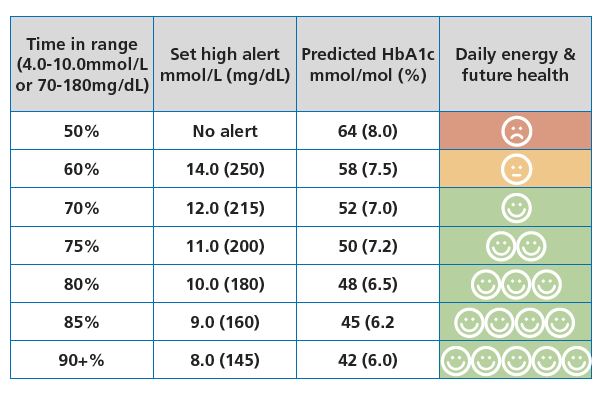
Time in range – what to aim for
Time in range (TIR) is the percentage of time glucose stays between 3.9 – 10.0 mmol/L (70 – 180 mg/dL). Higher TIR tends to associate with better day-to-day energy and reduced long-term risk. But there is a real trade-off: the effort and mental load of diabetes management tends to increase as TIR targets tighten.
The international consensus target for time in range is 70%, which is a solid, realistic starting point. The Measuring success Foundations guide explores what that number means in real life.
The goal is finding a sustainable sweet spot between TIR and quality of life. That balance will shift over time as priorities change – and that’s entirely normal.
Rather than chasing day-to-day perfection, CGM is most powerful when used to learn patterns, adjust one lever at a time, and aim for a TIR that fits your current life.
This content is for educational exploration only. It describes average responses and general principles. It is not medical advice and cannot replace individual clinical guidance from your diabetes care team.
Evidence backbone
The CGM accuracy figures, the trend arrow framing, and the “when in doubt, get the meter out” principle on this Foundations page are all grounded in the GNL CGM Evidence Pack. For a deeper read on accuracy assessment and the calibration zone effect on time in range, see How to Choose a CGM and CGM Accuracy Explained. Both pages link directly to the foundational sources:
- Pemberton et al 2026 – International clinical opinion on CGM transparency, standardisation, and calibration alignment. DOI: 10.1111/dom.70460
- Pleus et al 2025 – IFCC Working Group clinical assessment guideline. DOI: 10.1016/j.cca.2025.120728
Foundations pages keep citation density light. The full evidence pack lives on the CGM Guide pages.
CGM Basics Knowledge Check
You have seen what CGM shows and why the trend arrow matters more than any single number. A short assessment checks it has landed, and 9 out of 10 earns your certificate.
Part 2 of 12
CGM Basics