
TL;DR
Not all CGM systems report the same glucose level on their displays, despite measuring the glucose in the same place!
CGM systems can be grouped into three categories based on what the on-screen number represents. The on-screen glucose values and trend arrows used for treating hypos, giving correction insulin, adjusting food, exercise, or bolus timing.
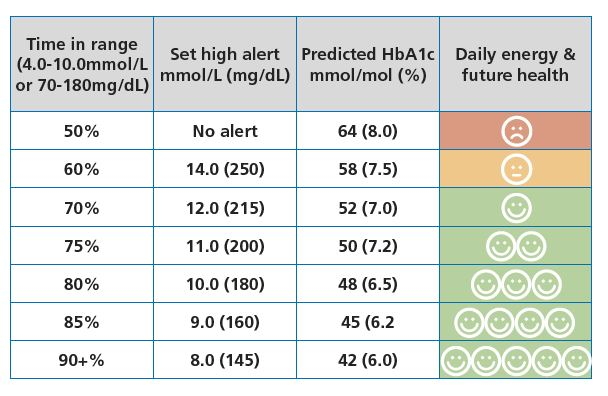
Those same displayed values also generate your percentage Time in Range and Time Below Range, typically defined as:
- TIR: 3.9–10.0 mmol/L (70–180 mg/dL)
- TBR: <3.9 mmol/L (<70 mg/dL)
They’re the metrics used to judge diabetes management and future diabetes related complications risk. So if two devices report systematically different numbers, they can make the same physiology look better or worse on paper, and change decisions!
That’s why knowing which Zone a CGM reads in really matters. It affects day-to-day decisions, how to interpret patterns, what treatment changes to make, and ultimately how well the data reflects true glucose exposure and long-term health risk.
The Zones
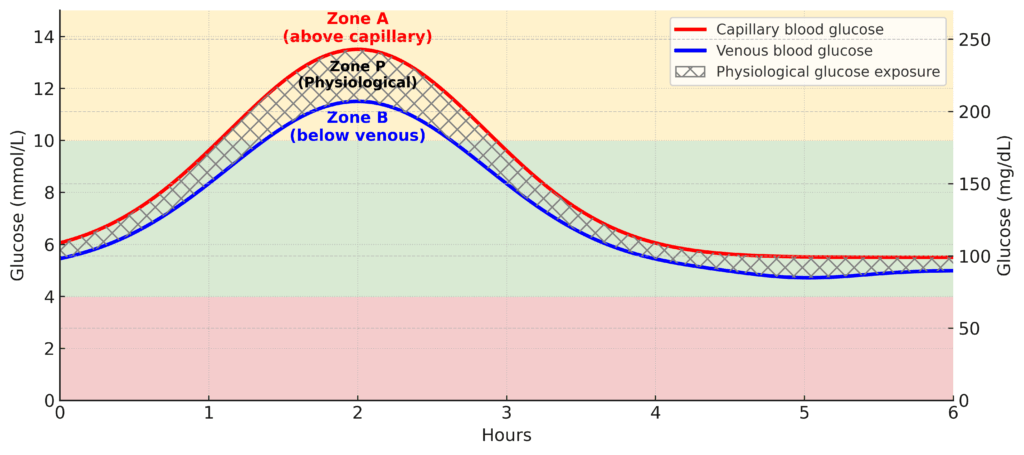
Zone A:
Some systems read above true physiological blood glucose, especically when the glucose rises above 10.0 mmol/L (180 mg/dL). In other words, they over-read.
Zone P:
Some systems read true physiological blood glucose, especically when the glucose rises above 10.0 mmol/L (180 mg/dL). In other words, the displayed value closely matches the glucose your body is actually exposed to in the blood.
Zone B:
Some systems, by design, and for safety to prevent over-delivery of insulin, under-read consistently. This is pronounced when the glucose rises above 10.0 mmol/L (180 mg/dL). Their readings are systematically below your true blood-glucose exposure.
Zone UNKNOWN:
Most worryingly, for some systems we don’t know whether they read above, within, or below true blood glucose, because the relevant performance data aren’t publicly available.
Why does this matter?
Because most of our evidence for glucose targets, Time in Range (TIR; 3.9–10.0 mmol/L or 70–180 mg/dL), and long-term complication risk was generated using Zone P systems. That means a benchmark like 70% TIR is appropriate for Zone P devices, but it is too low for Zone B devices.
Zone B systems typically read lower than true physiological blood glucose. So to achieve the same real glucose exposure as 70% TIR on a Zone P device, a person using a Zone B device usually needs a higher displayed TIR target (roughly 75–80%).
This mismatch also matters because it changes:
- how AID (automated insulin delivery) systems respond to readings, and
- how HbA1c aligns with CGM-reported metrics like TIR and average glucose
What would help fix this mess?
We need three things — in this order:
- Public release of performance data for every system.
- A clear declaration of which Zone a CGM reports in.
- Globally standardised CGM performance testing, so we can make true like-for-like comparisons across devices.
Once that exists, we can finally set Zone-specific targets, based on what the device actually shows the user. Until then, TIR must always be interpreted relative to the Zone your CGM measures in, and your HbA1c MUST guide your understanding of future risk!
The rest of this page puts meat on the bones. If you read it carefully and really understand it, you’ll know more than about 98% of people in the diabetes space about what CGMs actually measure, and how that shapes everything downstream.
The quintessential mantra that should guide all diabetes-related glucose decisions is this:
Understand what your CGM is measuring, and what that number really means.
The best and most effective people in the world never forget the core truth:
“What gets measured gets managed”
So it’s time to find out what your CGM numbers truly represent.
The simple version
Every CGM system measures glucose in the interstitial fluid just beneath the skin. However, manufacturers calibrate their sensors to different reference points within the glucose “ecosystem”. Some are tuned to sit within true blood-glucose exposure — the physiological range between capillary and venous glucose, hence we call these Zone P CGM systems. Other CGM systems are calibrated to read slightly lower than the physiological range, especially when rising and above 10.0 mmol/L (180 mg/dL), we call these Zone B CGM Systems.
This difference appears small on paper (5–10%), but it changes how your data look on the screen, how AID systems behave, and how your own decisions feel day to day.
If your CGM reads lower than true glucose, especially when above 10.0 mmol/L or 180 mg/dL (Zone B), your numbers will appear smoother and more in range. That means you might hit 70% TIR more easily, even if the body has actually been exposed to more glucose.
If your CGM reads within true glucose exposure (Zone P), especially above 10.0 mmol/L or 180 mg/dL, then the target of 70% TIR is valid because the evidence behind this target was built using devices that read in this zone.
So the message is simple: 70% TIR is only equivalent across devices if they measure in the same zone (especially when above 10.0 mmol/L or 180 mg/dL).
Zone B: reads below true physiological glucose
These systems typically read lower than venous glucose when above 10.0 mmol/L or 180 mg/dL.
They can trigger low glucose alerts too early, smooth post-meal highs, and make TIR appear higher than actual glucose exposure.
To match the long-term risk profile of a Zone P system achieving 70% TIR, a Zone B device usually requires closer to 75–80% TIR.
But don’t fret: hitting 75–80% TIR on a Zone B system is typically easier than on a Zone P system.
Why?
Because Zone B sensors under-read when abive 10.0 mmol/L (180 mg/dL), so glucose appears to rise more slowly and peak lower than it would on a Zone P CGM system.
This is why 70% TIR on one CGM is not automatically equivalent to 70% TIR on another. It depends entirely on whether the system displays glucose values close to the body’s true exposure or consistently below it.
Where current systems sit
Most established CGM systems fall clearly into Zone P or Zone B. However, a growing number of devices provide no publicly available paired accuracy data, making it impossible to classify them — and this lack of transparency represents an unknown risk on many levels.
CGM systems reading in Zone P
These systems align with physiological glucose exposure and match the CGM systems that provided the data from which current global CGM targets (including 70% TIR) were derived.
| Device | Manufacturer | Bias to Venous Blood Glucose< (when above 10.0 mmol/L or 180 mg/dL)/th> | Comparator |
|---|---|---|---|
| FreeStyle Libre 2 / 2 Plus / 3 / 3 Plus | Abbott | +5% | Venous |
| Dexcom G7 / ONE+ | Dexcom | +5% | Venous |
| Dexcom G6 / ONE | Dexcom | +2% (estimated) | Arterialised Venous |
| Accu-Chek SmartGuide | Roche | +2% (estimated) | Capillary |
CGM systems reading in Zone B
These systems read below venous glucose when above 10.0 mmol/L (180 mg/dL). This results in higher reported TIR percentages that under-report true physiological blood glucose exposure.
| Device | Manufacturer | Bias to Venous Blood Glucose (when above 10.0 mmol/L or 180 mg/dL) | Comparator |
|---|---|---|---|
| Eversense E3 / 365 | Senseonics | −2% | Venous |
| MiniMed Simplera / Guardian 4 | Medtronic | −10% | Venous |
CGM systems with unknown measurement zone
These systems cannot be classified because they either publish no performance data, do not report study design in sufficient detail, or include insufficient paired glucose samples. Without this information, it is not possible to state with confidence whether they read in Zone A, P, or B when above 10.0 mmol/L (180 mg/dL)
| Device | Manufacturer | Rationale |
|---|---|---|
| SiBionics GS1 | SiBionics | Insufficient paired data |
| Sinocare iCan | Sinocare | Insufficient paired data |
| Linx CGM | MicroTech | Insufficient paired data |
| Yuwell CT3 | Yuwell / POCTech | Insufficient paired data |
| Urathon CGM | Urathon / POCTech | Insufficient paired data |
| Syai Tag | Syai Health Technology | Insufficient paired data |
| GlucoRx AiDEX | MicroTech | Insufficient paired data |
| Medtrum A8 Nano | Medtrum | Insufficient paired data |
| i-SENS CareSens Air | i-SENS | Insufficient paired data |
| Infinovo GlucoNovo | Infinovo | Insufficient paired data |
Zone P vs Zone B CGM Sytems
If a CGM system under-reports glucose above 10.0 mmol/L (180 mg/dL)—particularly during rising glucose—this can materially influence insulin dosing decisions made by users, AID systems, and clinical therapeutic decision-making.
Compared with CGM systems that do not under-report in this range, under-reading devices can distort perceived glucose stability, alter how TIR maps to HbA1c, and ultimately affect interpretation of long-term risk.
Understanding a CGM system’s measurement zone allows users to account for system behaviour when making decisions, enables clinicians to adjust clinical targets appropriately, and supports informed adjustments to AID settings and medication behaviour.
Understanding the physiology: why capillary and venous glucose differ
Capillary blood reflects glucose freshly delivered to tissues, before uptake. Venous blood reflects what remains after the tissues have extracted glucose for energy. This creates a consistent 5–10% difference between them, and after meals the gap can reach 30%.
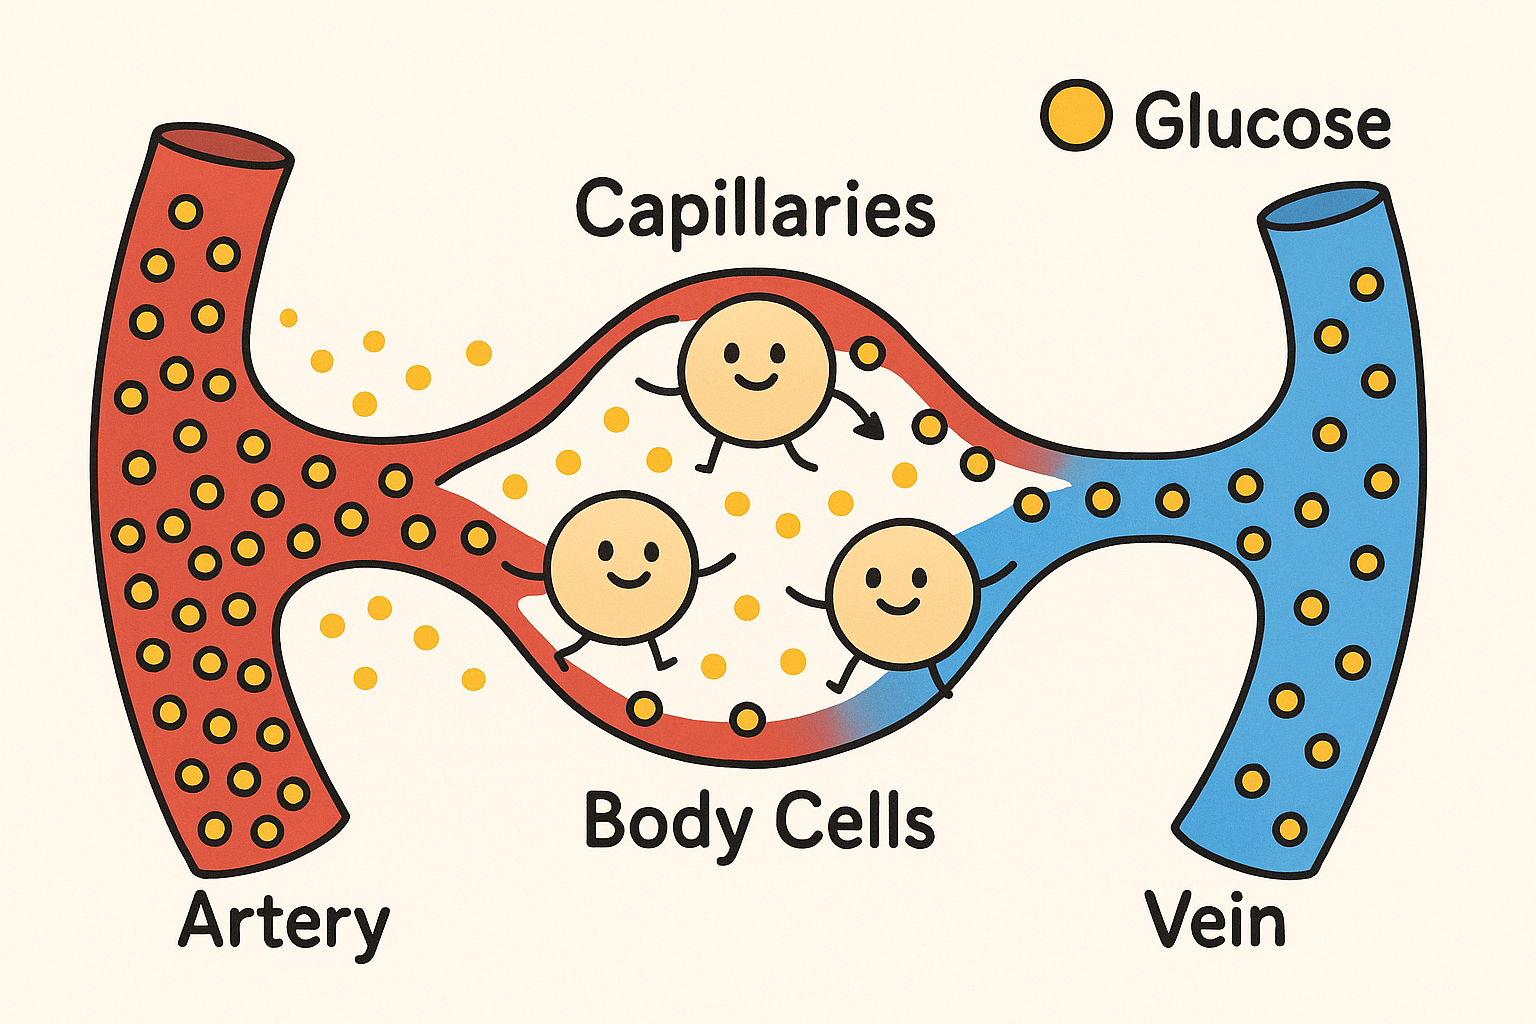
Every CGM system must choose which physiological signal it aligns with. That choice determines how glucose appears on the screen, how quickly levels seem to rise or fall, and ultimately how AID algorithms and users behave in response to the glucose values and trend arrows.
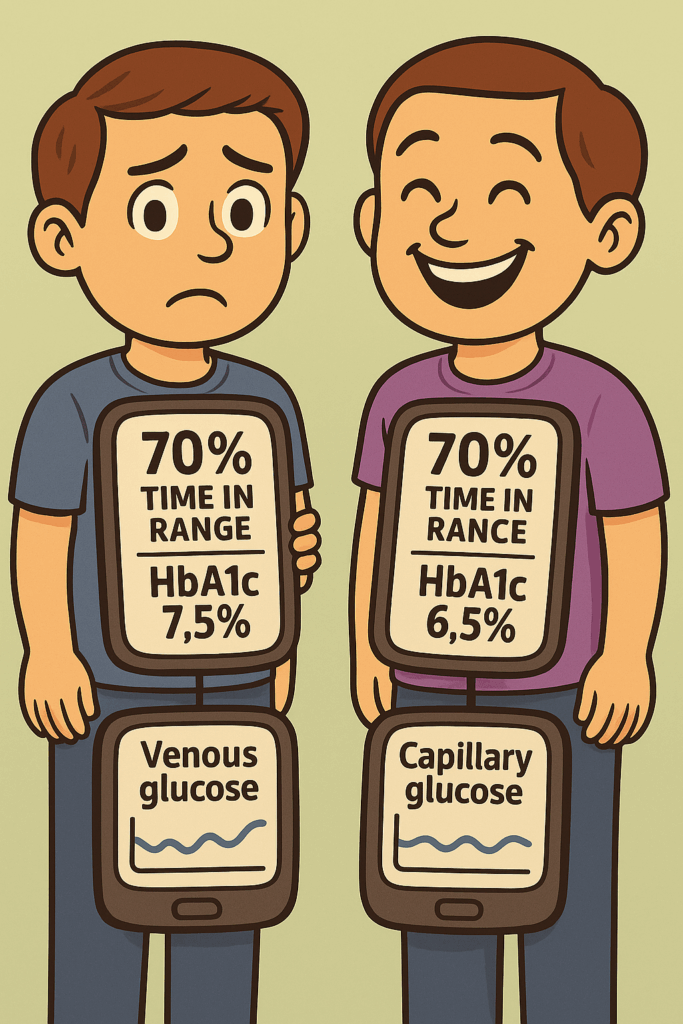
The identical twin problem: same TIR, different outcomes
Imagine two identical twins with type 1 diabetes. One uses a Zone P CGM; the other uses a Zone B system. Both hit 70% TIR for 20 years. One develops complications earlier and has consistently higher HbA1c. Why?
Set aside the biological variation in HbA1c that we know is real. Yes — people with genuinely similar glucose exposure can still end up with different HbA1c values because of factors like differences in red blood cell lifespan, or varying rates of vitamin C use to protect red blood cells, as the very clever Dr James Hempe has described. Other biological mechanisms likely contribute as well, but they’re beyond the scope of this piece. If you want the full dive on what this variation is, why it happens, and why it genuinely matters for understanding future health risk, read this article on HbA1c and CGM.
But here’s the key move: identical twins share essentially the same biology. So if identical twins show different HbA1c values despite the same apparent CGM-measured exposure, what explanation is left?
The remaining candidate is measurement error. Specifically, a Zone B device is systematically under-reporting true glucose exposure. The CGM makes time-in-range look better than it really is, but HbA1c acts as the audit trail and exposes the mismatch.
In short: when biology is held constant, a persistent HbA1c gap in the face of “identical” CGM data implies the CGMs are reporting a different glucose level despite measuring the same glucose in the fat tissue (interstitial space) — and HbA1c is calling its bluff.
The health cost?
The literature suggests that for each 10 mmol/mol rise in HbA1c (≈1.0%), the risk of both microvascular and macrovascular complications increases by roughly 30–40%.
So a 5 mmol/mol (0.5%) rise maps to about a 15–20% increase.
But read that carefully: this is relative risk, not absolute risk. It does not mean your chance of complications is suddenly “30–40%”. It means your risk increases by 30–40% relative to whatever your baseline risk already was.
That distinction matters a lot. If your baseline absolute risk is low, a big-sounding relative increase may translate into a tiny real-world change. For example, a 40% relative increase on a 1% baseline risk raises it to 1.4% — not nothing, but hardly the apocalypse. On the other hand, if your baseline risk is already high, the same relative increase is a serious deal: a 40% relative rise on a 20% baseline risk pushes it to 28%.
This relative-versus-absolute risk confusion is exactly why headlines like “risk goes up 40%” regularly mislead people. If you want a great general explanation of why this matters and how to think about it properly, Peter Attia lays it out clearly in his studying studies guide.
How TIR leads to HbA1c — and why CGM zone affects both
Mounting evidence shows a clear relationship: each 10% change in TIR corresponds to about a 5 mmol/mol (≈0.5%) change in HbA1c. Importantly, Zone P systems were used to generate the data for these relationships.
Newer long-term studies show that a sustained 5% improvement in TIR predicts around a 20% reduction in risks for eye and kidney disease. But again, this is based on Zone P CGM data. If your CGM measures in Zone B, a reported 70% TIR very likely will mean a higher physiological glucose exposure, than someone hitting 70% TIR on a Zone P CGM system.
A 5% improvement in TIR on a Zone B system is likely equivalent to the same benefit for a 5% improvement on a Zone P system.
But in absolute terms, real-world glucose exposure is different, because Zone B systematically under-reads.
That means: to reach the same long-term risk profile, the reported TIR you’d need on Zone B is likely higher — plausibly by about 5–10% — to compensate for the device’s bias.
So again, this is the relative–absolute trap: equal TIR does not mean equal biological reality underneath. HbA1c (or other outcome-anchored measures) is what tells you whether the “improvement” was real or just a nicer-looking graph.
AID systems: why measurement zone changes algorithm behaviour
AID systems rely entirely on CGM data. If a CGM consistently reads below true glucose, the algorithm will:
- reduce insulin earlier, thinking hypos are coming
- suspend insulin more often
- allow higher post-meal exposure
- The user may also overtreat “false lows”, pushing true glucose higher than intended.
This pattern shows up most clearly in the high-stakes setting of type 1 diabetes in pregnancy.
AID systems that rely on Zone P CGM devices (Dexcom G6/G7) — such as CamAPS Fx and the t-slim with Control IQ — have been shown in randomised control trials to improve both maternal and neonatal outcomes compared with injections and standard pump therapy with CGM.
By contrast, a randomised trial investigating an AID system driven by a Zone B CGM did not find better pregnancy outcomes versus standard therapy with CGM. However, the trial reported quality of life for the AID groups. Pragmatically, that’s why current T1D and pregnancy guidance favours AID systems paired with Zone P CGMs when they’re available.
Important caveat: pregnancy isn’t my clinical lane, and I don’t know the evidence well enough to comment on every nuance or guideline detail. But the overall signal still supports the broader point: when small glycaemic fluctuations have outsized consequences, prioritising a Zone P–based AID system (if available) looks like the lowest-risk choice.
If a Zone P-driven AID system isn’t accessible, then a Zone B-based system is still worth using for the quality-of-life gains it brings. But over a nine-month window where outcomes matter intensely, the logical ordering is: outcomes first, quality of life second.
Regulation: why this problem exists and why it is worsening
EU MDR (2017/745) recognises the need for public performance datasets but its central database is still not operational. This leaves gaps where devices can enter the market without releasing paired accuracy data.
Established CGM companies publish clinical data voluntarily. Others do not. Some systems are already being prescribed for insulin dosing with:
- no published comparator type
- unknown bias
- insufficient T1D data
- no transparent accuracy dataset
This creates a situation where 70% TIR on one device may correspond to 60% or 80% physiological exposure on another — an untenable situation for clinical care.
A practical analogy: the degree classification problem
If you study for four years and your tutor marks generously, telling you you’re averaging 70%, you expect a first-class degree. But if their marking runs 10% high, your true score might be closer to 60% — and your future opportunities change dramatically.
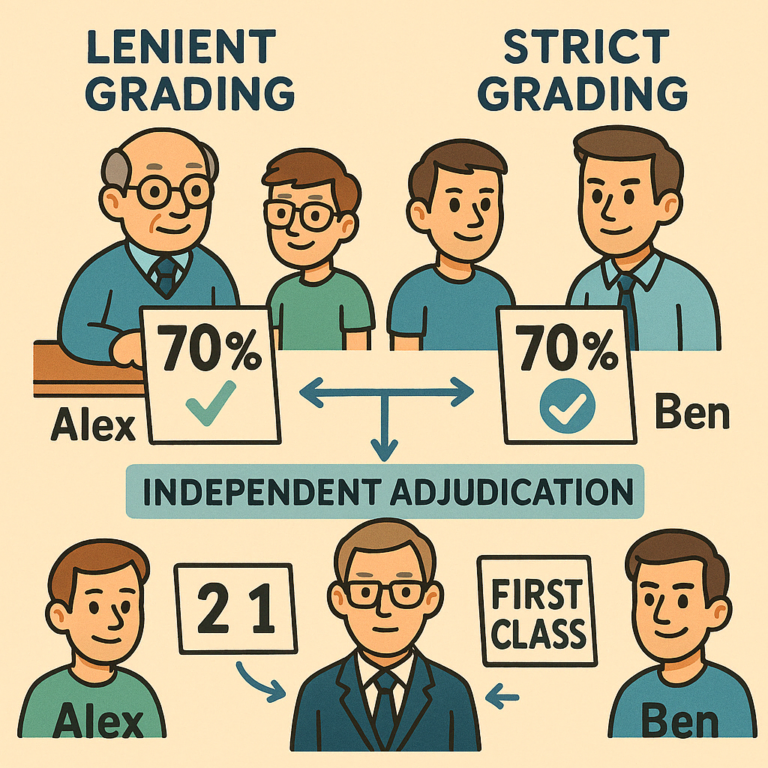
CGM works the same way. A generous (Zone B) CGM can make your glucose exposure look “first class” while your true exposure is not.
What this means for you: practical actions
Your CGM’s calibration zone shapes how your numbers appear, how your AID system behaves, how you make insulin and hypo treatment decisions, and how you interpret time in range targets. After all,
“What gets measured, gets managed”
If you use a Zone P CGM
You can use standard international targets as intended:
- ≥70% TIR (3.9–10.0 mmol/L)
- <4% below 3.9 mmol/L
- <1% below 3.0 mmol/L
- GMI roughly aligns with HbA1c
Your data already reflect true physiological exposure and maps with the data used to set the international targets. Interpretation is straightforward.
If you use a Zone B CGM
These systems typically under-read true glucose exposure. This means the same TIR value likely corresponds to higher actual glucose exposure. To match the risk profile of 70% TIR on a Zone P device, consider aiming for:
- 75–80% TIR (3.9–10.0 mmol/L or 70-180 mg/dL)
- Expect earlier low alerts and more false lows
The safest approach is to combine TIR, HbA1c, and consult with your health care team.
If you use an Unknown-zone CGM
You cannot reliably interpret TIR. The CGM device may be under-reading, over-reading, or shifting across glucose ranges.
- Be cautious with targets — TIR may not map to risk
- AID systems using glucose values from these CGM devices present an unknown risk
What clinicians should consider
- 70% TIR is not universal — it depends on CGM measurement zone
- HbA1c/TIR mismatch often reflects device bias rather than user behaviour
- AID performance depends on CGM bias
- Evidence-based targets require Zone P alignment and other CGM devices may require different targets
Of special note: Zone B systems are not inferior — they’re just optimising for a different safety trade-off. Their bias tends to reduce the risk of insulin over-delivery and may even be protective against hypoglycaemia. The flip side is that, to achieve the same true glucose exposure (and therefore similar long-term risk) you may need about 5–10% more reported TIR on a Zone B device. Clinically, that likely means aiming for something like 75–80% TIR, which is often achievable precisely because there are fewer recorded “high” excursions.
The real problem appears when someone sits at ~70% TIR on a Zone B system and is told they’re “at target.” If the device is under-reading, they may not be at equivalent risk — and treatment might not be intensified when it safely could be. That’s the risk of using a single 70% TIR target for everyone without accounting for device bias.
Yes, this makes teaching a bit more complex. But the choice is basically:
- keep it “simple” and risk underestimating exposure (and therefore risk) for a chunk of people, or
- spend a little more time explaining the adjustment so that risk is more equal across patients using different systems.
As a person living with T1D, I’d take the second option every time. Clarity beats convenience when the metric is steering clinical decisions.
Choices from here:
- What the different CGM systems offer
- Top 10 tips for optimising time-in-range using CGM systems
- Skincare when using CGM systems
- Understanding risk and CGM testing
- Understanding the different accuracy measures of CGM systems
- Detailed deep dive in CGM regulation
Or now you are zone aware, jump to read about what the different systems offer.
References
Below are the core scientific sources underpinning the physiology, accuracy, and clinical implications discussed on this page. All links open in new tabs.
- CGM accuracy comparison of Simplera vs Dexcom G7 and FreeStyle Libre 3
- IFCC Working Group on CGM — standardisation recommendations
- eCGM proposal for evidence requirements in Europe
- Relationship between TIR and HbA1c
- TIR and microvascular complications risk modelling
- Pregnancy outcomes with different AID systems
- Capillary vs venous glucose physiology and measurement differences
- CGM accuracy standards and comparator issues
- AID performance and reliance on CGM bias
- GMI limitations and HbA1c mismatch
- Impact of glucose variability and exposure on long-term complications
- TIR as a predictor of microvascular risk (multi-cohort analysis)
- Abbott–Medtronic CGM partnership announcement