
Prefer a Podcast series?
Yes, listen to the CGM 3-Part Series
If you prefer reading, enjoy what has consumed me for six years.
What is Continuous Glucose Monitoring (CGM)?
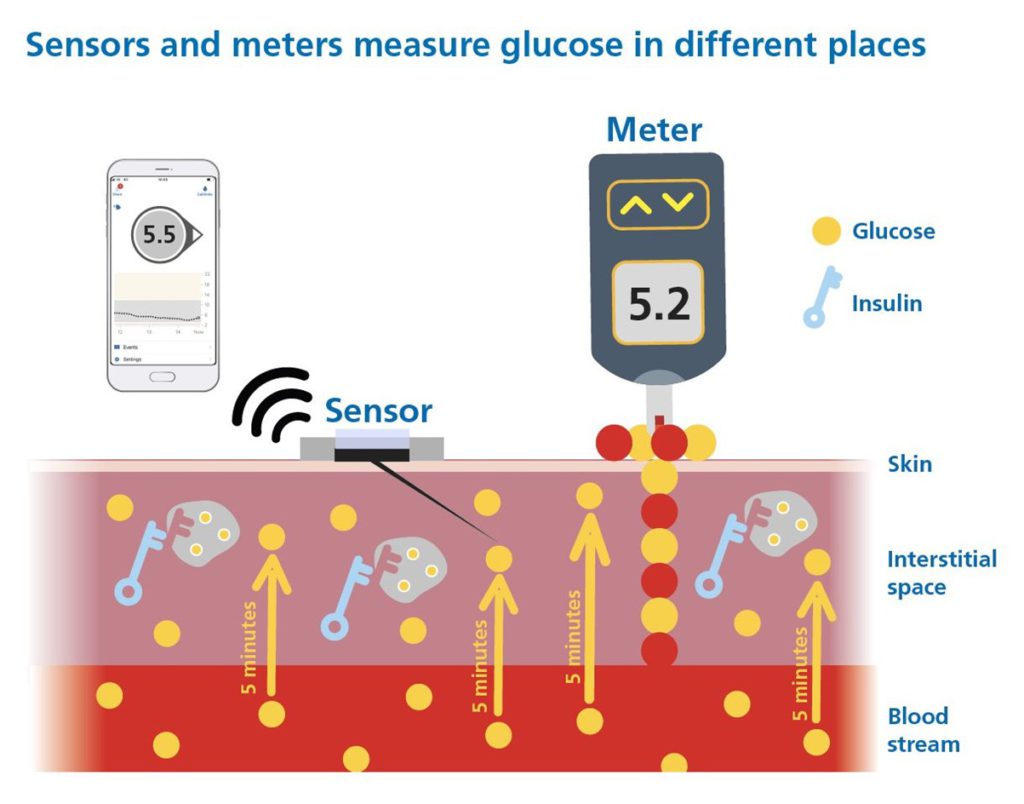
A Continuous Glucose Monitor (CGM) is a wearable device that tracks glucose levels day and night, providing real-time readings with trend arrows and alerts for high and low glucose levels. CGMs are a critical tool for diabetes management, offering insights beyond traditional blood glucose monitoring (finger-pricking). The picture below explains CGM and how the trend arrows help see into the future!
For the basics, read the CGM foundations.
However, not all CGMs are created equal, and choosing the right one requires more than comparing advertised accuracy numbers and bells and whistles!
Adjunctive vs. Non-Adjunctive Use: Why It Matters
CGM devices fall into two main categories:
- Adjunctive CGM: Requires confirmation with finger-prick blood glucose (SMBG) before insulin dosing and hypoglycaemia management.
- Non-Adjunctive CGM: Approved for insulin dosing decisions and hypoglycaemia management.
This guide is only concerned with those that have non-adjunctive approval.
When it comes to CGMs for insulin dosing and hypoglycaemia management, risk assessment comes first!
Why Risk Assessment Comes First
Before comparing CGMs based on performance, we must assess the risk of using a particular CGM.
Think of it like scouting a football player.
If I claimed I have scored as many goals as Messi and Ronaldo, yet I cost half the price, would you sign me instantly?
Or would you first ask:
- Where did you score those goals? (Top leagues or Sunday league football?)
- How competitive were the matches? (Practice or real games?)
- How do you perform at the top level, in the biggest games, when it matters most, and under severe pressure?

A CGM might advertise a Mean Average Relative Difference (MARD) of 10%, which suggests that, on average, the CGM readings are only 10% different from actual blood glucose levels.
However, unless we know how and where it was tested, MARD and other performance statistics are, well… meaningless.
Without robust testing, choosing a CGM is like buying a car that has only been test-driven at the national speed safety limit in the middle lane.
In reality, people use all three lanes and sometimes change lanes rapidly, just as glucose levels fluctuate in real life.
Would you drive a car that’s only been tested like this?

Five Key Questions for CGM Studies
To understand a CGM’s performance, we must examine how its accuracy was tested. The POCT05 guidelines, the eCGM Clinician Consensus, and the IFCC Working Group for CGM outline five critical questions for CGM systems approved for insulin dosing decisions.
The five answers help determine whether a CGM has been assessed across the full glucose measurement range (typically 2.2-22.2 mmol/L or 40-400 mg/dL) moving at speeds that occur in the daily life of insulin users.
Q1. Has the data been peer-reviewed by a journal (a reputable diabetes technology one) or by the FDA in America?
Both involve expert scrutiny of the study design, participant selection, testing methods, and outcomes. This kind of review increases confidence in the robustness of the data, brings transparency, and ensures that anyone — clinicians, people with diabetes, or regulators— can critically appraise the evidence for themselves.
In an environment where not all CGM data is equal, this level of review increases confidence that the study results have minimal bias.
Confidence in performance is paramount when deciding doses of a drug (insulin) that carries one of the highest risks of any prescribed drug!
Q2. What percentage of study participants had type 1 diabetes?
If fewer than 70% of participants had type 1 diabetes, the CGM might not have been tested in conditions where glucose fluctuates rapidly.
People with type 1 diabetes lack insulin production, meaning their glucose levels move faster than those with type 2 diabetes, allowing us to assess how well the CGM performs in extreme shifts.
Q3. Were meal and insulin challenges performed?
A robust accuracy study should intentionally induce high and low glucose conditions.
Giving food without insulin creates rapid glucose spikes, which occasionally happen in real life.
Giving too much insulin without food induces a fast glucose drop and hypoglycaemia, aka “Rage bolus!”
Without these tests, the CGM may not have been exposed to the real extremes that people with diabetes experience from time to time.
Q4. What percentage of comparison readings were less than 4.4 mmol/L (80 mg/dL)?
At least 8% of paired CGM and comparator (venous or capillary glucose) readings in the study should be below 4.4 mmol/L (80 mg/dL), according to the 2020 recommendations from an internationally renowned expert panel (Performance Metrics for Continuous Interstitial Glucose Monitoring, POCT05).
Of course, people with diabetes do not generally have 8% hypoglycaemia, but to check performance in this range, there must be adequate readings to assess performance.
Q5. What percentage of comparison readings were above 16.7 mmol/L (300 mg/dL)?
At least 5% of paired CGM and comparator (venous or capillary glucose) readings should exceed 16.7 mmol/L (300 mg/dL), in line with the recommendations outlined in the Performance Metrics for Continuous Interstitial Glucose Monitoring (POCT05).
Again, most people don’t run that high, but that percentage is needed for adequate readings to assess accuracy in the very high range.
If these extremes are not well-represented, the CGM’s ability to detect highs and lows is uncertain. We don’t want uncertainty about accuracy when treating hypos or giving insulin corrections when very high.
I purposely repeat!
Insulin carries one of the highest risks of any prescribed drug!
Which CGMs Have Been Tested Robustly for Insulin Dosing?
I’ve co-developed a set of CGM Comparison Charts with the Diabetes Specialist Nurse (DSN) Forum UK. The most up-to-date version is available on their website.

The first chart asks the five study design questions to identify which CGM devices have been tested using study designs that meet the most basic internationally recommended standards.
It is a useful overview of the CGM systems currently available in the European and UK markets, giving each device a score out of 5 based on study design.

Using these five questions is the equivalent of helping identify cars that have been tested in all three lanes going at different speeds, and those that have not.

Any CGM system with a study design score less than 4 does not provide enough evidence to understand its accuracy or the potential risks of readings in the high and low glucose ranges. The ranges when clinical or insulin dosing decisions are being made.
This remains true even if a CGM system has a CE mark allowing it to be marketed for non-adjunctive (insulin dosing) use across a wide age range.
More recently, CE marking for CGM systems driving “Automated Insulin Delivery (AID) insulin dosing”, without peer-reviewed published data, has led to serious concerns leading pediatric societies and adult specialist technology networks.
Why is this a concern?
We lack data on CGM performance during the most critical therapy periods when glucose levels are in the low and very high ranges. This does not mean those CGMs are unsafe; it means we do not know the risk.
Therefore, only the following CGMs meet the basic testing standards (score of 4 or higher), with non-adjunctive approval will be discussed from this point forward.
You might look at the study design table and question why adjunctive CGM systems — particularly those with a study design score below 4 — are available on prescription, given that the only individuals eligible for CGM under NICE guidance (NG17, NG18, NG28, TA943) are those using insulin.
It certainly makes me scratch my head!
The CGM devices with robust study design and non-adjunctive approval are:
- Accu-Chek SmartGuide
- Dexcom G6 and One
- Dexcom G7 and One+
- Freestyle Libre 2 and 3 Plus
- Medtronic Guardian 4
- Medtronic Simplera
What Should We Compare CGM Readings Against?
Now that we know which CGMs have been tested robustly, the next step is understanding what we should compare CGM readings against.
CGMs can be compared to different comparators:
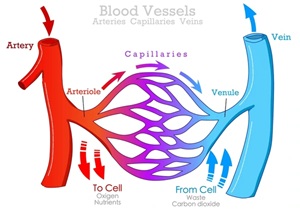
Venous Blood Glucose
- Drawn from veins (after glucose has been used by cells).
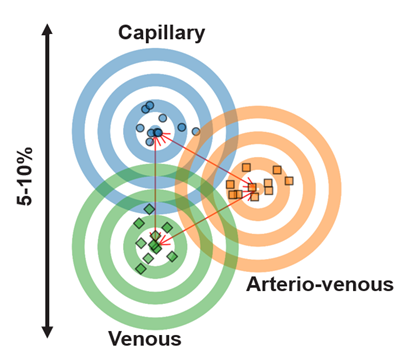
- Lower glucose concentration compared to capillary blood, by 5-10% overall, and even lower after eating when the glucose spikes!
Capillary Blood Glucose
- Drawn from small blood vessels (before glucose is absorbed by cells).
- Higher glucose concentration. This is the level your cells are exposed to, especially after eating, making it crucial for assessing potential damage and complication risk.
Key Takeaway
- Capillary glucose reflects the highest concentration of glucose your cells experience, making it a critical measure for understanding metabolic health.
Also, consider that a person with diabetes does not have an IV line in their veins at home to check the accuracy. They have a finger-prick tester to measure capillary blood glucose.
So, when assessing CGM performance, we must consider how the comparison method impacts accuracy. Let’s undertake a thought experiment.
Imagine two students, Alex and Ben, both working hard towards their degrees. Each of them has a different professor grading their coursework.
Alex’s professor, Dr. Lenient, is a bit relaxed with grading. If an answer is close enough, it gets full credit. Ben’s professor, Dr. Precise, is much stricter, only awarding marks when answers fully meet the criteria.
Despite these differences, both professors consistently score their students at 70%, making Alex and Ben believe they are on track for a first-class degree.
When their final dissertations are sent for independent adjudication, essentially the academic equivalent of an external HbA1c test, things change. The independent examiner follows a strict standard and re-evaluates their true level.
Alex, who was used to Dr. Lenient’s grading, discovers that some of his work wasn’t quite up to the expected standard. His final score gets downgraded, and he ends up with a 2:1.
Ben, who had already been scrutinised under a strict marking scheme, sees his grade hold steady, earning a first-class degree as expected.
Now, think of Alex’s professor as a glucose sensor measuring venous glucose; it’s systematically a little looser, underestimating the peak glucose levels the cells are exposed to. Meanwhile, Ben’s professor represents the sensor measuring capillary glucose, which is closer to the peak glucose exposure.
So, even though both sensors (or professors) suggest the same 70% score, when reality (HbA1c) is assessed externally, the stricter standard (capillary glucose) aligns better with the true outcome, just like Ben’s first-class degree.

Which Professor would you prefer to grade your work, Alex’s (venous aligned CGM system) or Ben’s (capillary aligned CGM system)?
Application to Glucose Monitoring
It’s essential to know whether a CGM system aligns with venous or capillary glucose values. To accurately capture glucose exposure, alignment with capillary glucose is ideal.
Why?
What gets measured gets managed
Remember, capillary glucose is 5-10% higher overall and even higher after eating when compared to venous glucose. People using venous-aligned CGMs may believe their glucose levels have been in range, only to discover later that their actual exposure to higher glucose levels was more than they realised.
The long-term “cost”?
Very likely, a higher risk of complications, even though they thought they were putting in the same effort.
This means that 70% in the target range (3.9-10.0 mmol/L) for a system aligned to venous glucose leads to a higher HbA1c than the same 70% achieved on a system aligned at capillary glucose.
Want examples from the current research?
- Medtronic 780G users require approximately 75% TIR to achieve an HbA1c of around 7% (53 mmol/mol), or 80% TIR to reach 6.5% (48 mmol/mol).
- Control-IQ users need only about 68% TIR for an HbA1c of approximately 7% (53 mmol/mol), or 74% TIR for 6.5% (48 mmol/mol).
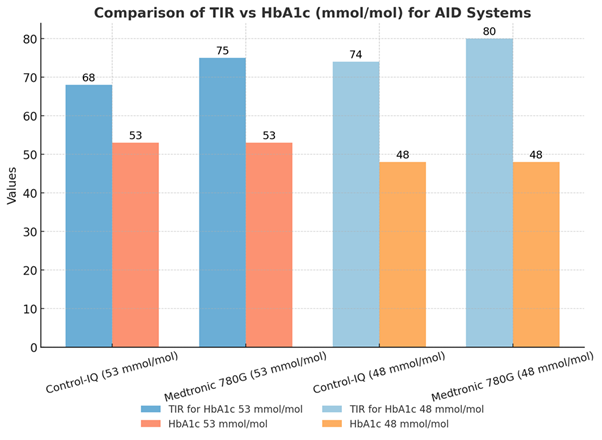
This discrepancy arises from differences in sensor alignment to either venous or capillary glucose:
- The Medtronic CGM (very similar sensor technology for the G4 and Simplera) used for the 780G is tested against venous glucose and therefore has a heavy negative bias to capillary glucose. The displayed CGM value for the Simplera reads on average 17% lower (supplementary materials) than the capillary glucose level, resulting in a significant underestimation of capillary glucose.
- The Dexcom G6 (used in Control-IQ) is tested against arteriovenous glucose (heating of the tested veins), bringing the comparison glucose level more in line with capillary glucose. The G7 (also tested against arteriovenous glucose) only has a 3% negative bias compared to capillary glucose, which is the same as the Freestyle Libre 3 (supplementary materials).
- As a result, this data suggests you can get away with a 5-7% lower time in range (3.9-10.0 mmol/L or 70-180 mg/dL) for a Dexcom G6/G7 sensor for the same HbA1c as that achieved with the Medtronic G4/Simplera.
Another example?
This picture highlights how the Medtronic Simplera underreports glucose exposure after eating because it aligns closely with venous glucose values rather than capillary glucose values. In contrast, the Dexcom G7 and FreeStyle Libre 3 track much more closely to capillary glucose, which more accurately reflects what the human body is exposed to (the study).
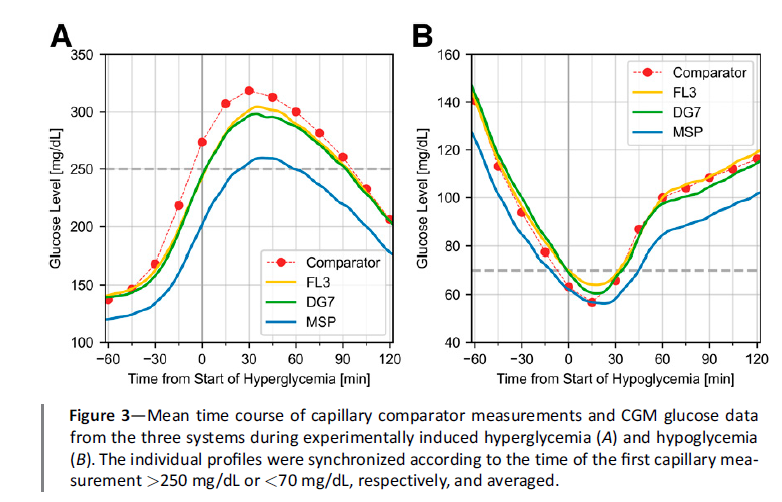
Under the principle of “what gets measured gets managed,” high glucose levels will be managed more effectively with the Dexcom G7 or FreeStyle Libre 3 than with the Simplera.
This also highlights the urgent need for the International Federation of Clinical Chemistry (IFCC) Working Group on CGM to complete and publish an international standard (ISO). The IFCC’s ISO guidance can’t come soon enough.
The consequence?
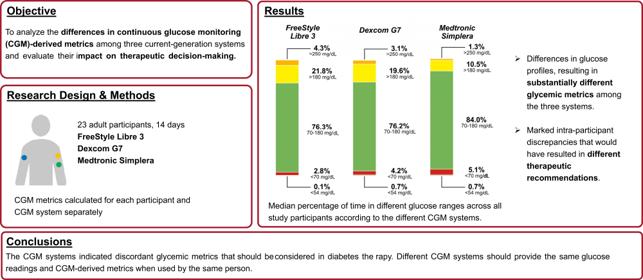
The Medtronic Simplera tends to overestimate time in range (3.9–10.0 mmol/L or 70–180 mg/dL) by around 8% and time in tight range (3.9-7.8 mmol/L) by 13%!
This can give users the false impression that their glucose control is excellent—they think they’re doing great, only to be surprised when their HbA1c result is higher than expected. The reality is that their body has been exposed to higher glucose levels than the Simplera had indicated.
On the other hand, users of the Dexcom G7 and FreeStyle Libre 3 receive a more accurate reflection of capillary glucose levels, giving them a clearer understanding of their glucose exposure—and with it, a better sense of their future complication risk. – See the study.
What does this mean?
This means we need to know how accurate a CGM system is compared to capillary glucose, not venous glucose.
And that is the next part of the guide,
Assessing CGM Accuracy Performance.