Story
My 120-Day Carb Experiment
I needed to settle the carbohydrate debate swirling in my mind, so I spent 120 days, across three very different approaches, finding out what actually happens when you change the balance of carbs, fat, and protein while living with type 1 diabetes.
What would it take?
120 days, three very different approaches to carbohydrates, and one key question:
“What actually happens when you change the balance of carbs, fat, and protein in the real world, day after day, while living with type 1 diabetes?”
As a diabetes dietitian, the “low-carb versus high-carb” debate was already everywhere. Patients asked me daily: Should I cut carbs? Should I try keto? The answer, as always, is it depends. But I wanted to know what it really looked like in practice. Not the theory, not the perfect-world Instagram version, what it felt like to live it.
So, I did. And here’s how it went.
Why I Did It
At the time, my goals were simple:
- Lose about 10% body fat
- See how carb restriction affects glucose, insulin use, exercise, and lipids
- Test whether I could realistically sustain lower-carb approaches
I’d been in good shape already, but I wanted to go further, leaner, more consistent, and armed with first-hand evidence I could share with patients.
The Setup
I kept some rules constant to make it a fair test:
- Approximately 2,500 kcal per day (a deficit of approximately 1,000 kcal)
- 10,000 steps every day
- Training: 4x strength + 2x HIIT sessions per week
- Alcohol out, hydration in
- Consistent bedtime and wake-up
Then I split the 120 days into three phases of approximately 40 days each.
Nutritional breakdown and lifestyle parameters
| Usual diet before experiment | HCLF, 40 days | LCHF, 40 days | KETO, 40 days | |
|---|---|---|---|---|
| Average daily carbohydrate intake (g) | 350 g (3.6 g/kg) | 345 g (3.5 g/kg) | 131 g (1.4 g/kg) | 16 g (0.2 g/kg) |
| % total energy from carbohydrate | 44% | 50% | 20% | 3% |
| Average daily fat intake (g) | 140 g (1.5 g/kg) | 55 g (0.6 g/kg) | 140 g (1.5 g/kg) | 186 g (2.0 g/kg) |
| % total energy from fat | 35% | 20% | 50% | 67% |
| Average daily protein intake (g) | 185 g (1.9 g/kg) | 185 g (1.9 g/kg) | 185 g (1.9 g/kg) | 185 g (1.9 g/kg) |
| % total energy from protein | 21% | 30% | 30% | 30% |
| Daily energy intake | 3,500 kcal | 2,500 kcal | 2,500 kcal | 2,500 kcal |
| Supplements | Creatine 3 g/d, multi-vit and min, caffeine 400 mg/d, whey protein 90% | Creatine 3 g/d, multi-vit and min, caffeine 400 mg/d, whey protein 90% | Creatine 3 g/d, multi-vit and min, caffeine 400 mg/d, whey protein 90% | Creatine 3 g/d, multi-vit and min, caffeine 400 mg/d, whey protein 90%, Slo-Mag (300 mg Mg, 500 mg Ca), potassium 2 g/d, sodium 2 g/d |
| Average hours sleep per night | 7.5 hours | 7.5 hours | 7.5 hours | 7.5 hours |
| Average time exercising per week | 300 minutes | 300 minutes | 300 minutes | 300 minutes |
Phase 1: High-Carb, Low-Fat (Days 0-40)
This was my baseline. The diet was flexible, but I had to stay disciplined to keep calories down.
- Macros: 45-55% carbs, 30-35% protein, 15-25% fat.
- Strategy: Three consistent meals per mealtime. It worked. Count the carbs, dose insulin, and glucose stayed predictable.
- Challenges: Any shifts in carb/fat balance threw things off. Pre-bolus timing, post-meal walks, and occasional corrections were necessary.
- Exercise: Worked fine with careful planning.
- Social life: Pretty manageable, nothing radical needed.
This phase reminded me how much predictability matters. I could manage anything with insulin and structure, but it required a lot of micromanagement, Dynamic Glucose Management style.
Phase 2: Low-Carb, High-Fat (Days 40-80)
Here I cut out starches and leaned on fruit, vegetables, and higher fat intake.
- Macros: approximately 50% fat, 30% protein, 20% carbs.
- Insulin adjustment: I had to count 50% of protein as carb, otherwise boluses weren’t accurate.
- Benefits: Way less need for pre-bolus precision or corrective walking. Meals were steadier, glucose more predictable.
- Challenges: Shopping and cooking had to be consistent, no room for last-minute changes.
- Exercise: Easier to manage glucose, but I noticed HIIT performance start to slip toward the end.
- Social life: Reasonable with some swaps (more steak and veg, fewer chips and bread).
This felt like the “sweet spot” of balance: lower stress, steadier glucose, but still functional for everyday life.
Phase 3: Keto (Days 80-120)
This was the strictest, and, honestly, the hardest.
- Macros: 60-70% fat, 30-35% protein, 5% carbs.
- Insulin: Counted only 25% of protein as carb. Boluses were minimal, and glucose was incredibly stable.
- Challenges: Constipation, electrolyte imbalance, hydration. Needed magnesium and potassium supplements.
- Exercise: Gym performance dropped hard. High-intensity was a struggle.
- Social life: Very tough. Eating out required planning ahead or just saying no.
KETO and blood ketone measurements
Although the last 40 days were called KETO, it is actually misleading. I measured my blood ketone levels every day, they never went above 0.2 mmol/l.
Only when I dropped my protein intake from 1.9 g/kg to 1.0-1.2 g/kg (100-120 g) did I get ketones in the nutritional ketosis range of 0.6-3.0 mmol/l.
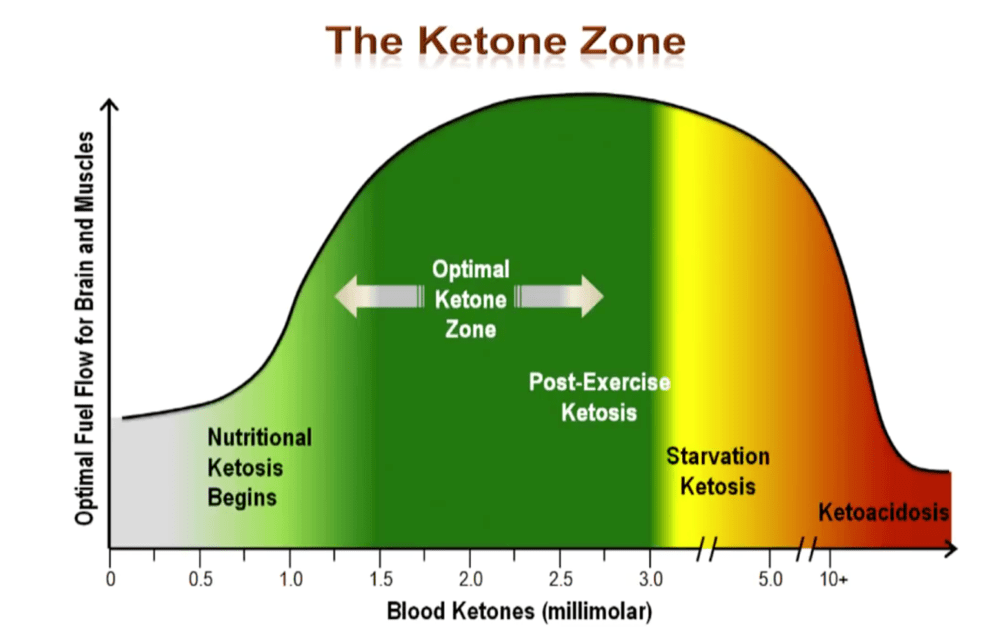
The suggested benefits of having blood ketone levels of 0.6-3.0 mmol/l are:
- Reduced hunger.
- Anti-inflammatory effect in the brain by using ketones rather than glucose as fuel.
- Providing the brain with around 30% of its fuel, potentially increasing cognitive sharpness.
Ketones are only made in the liver and kidneys, so for the brain to be getting a consistent supply, blood levels need to consistently sit at 0.6-3.0 mmol/l.
Why ketone levels didn’t reach the target range
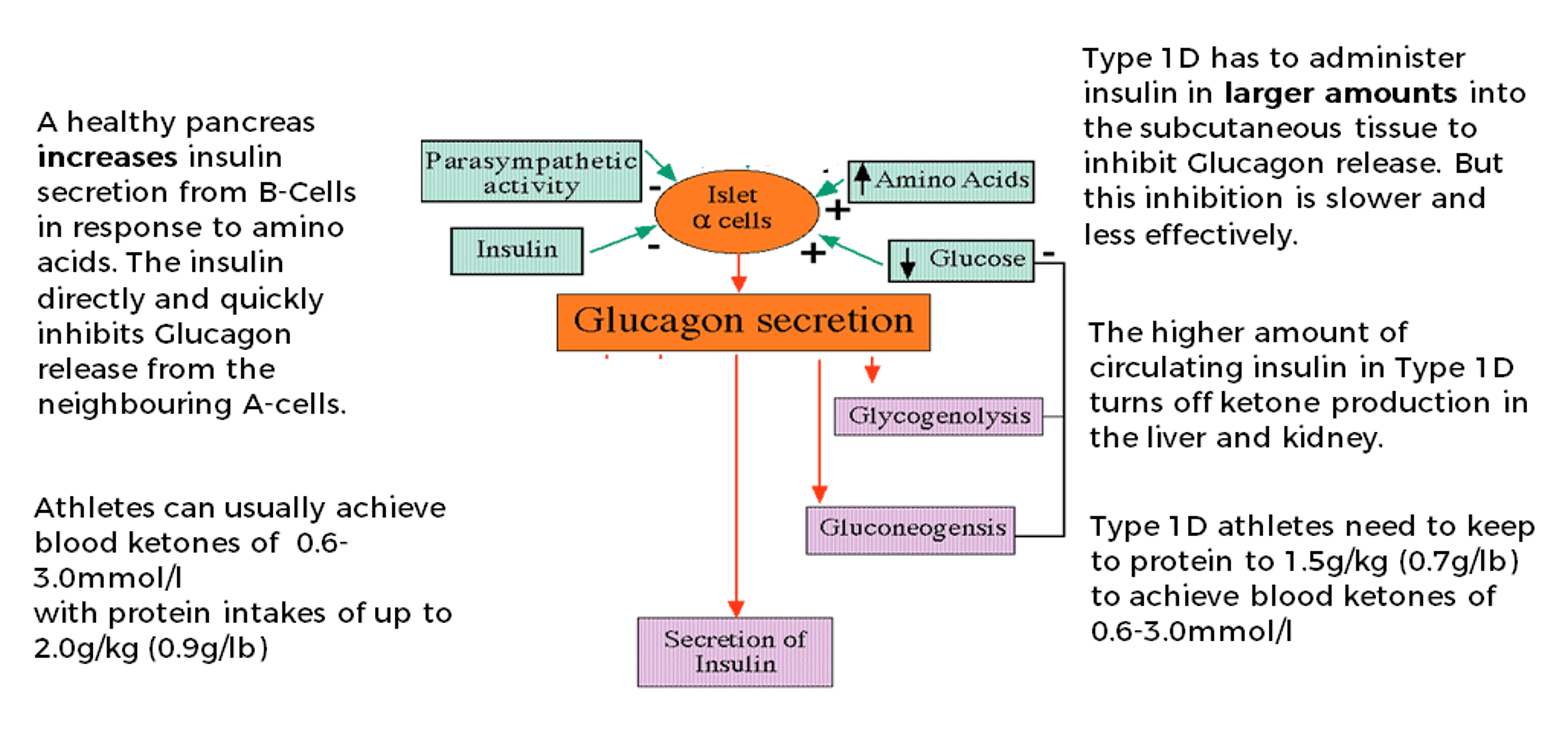
There is one main reason: the effect of protein on insulin and glucagon.
Amino acids from protein digestion cause the alpha-cells in the pancreas to release glucagon. To prevent too much glucagon from being released and liberating glucose from the liver, a healthy pancreas also releases insulin from the beta-cells in response to protein ingestion. The insulin directly inhibits the alpha-cells from releasing too much glucagon. This works effectively for people with a healthy pancreas if protein intake is kept within limits:
- For non-active people: 1.2 g/kg (0.5 g/lb)
- For very active people: 2.0 g/kg (0.9 g/lb)
If protein intake goes above this, glucagon is released in large amounts, and more insulin is released from the beta-cells. The high level of insulin reaches the liver and kidneys where it turns off ketone production. Therefore, if protein intake is too high, nutritional ketosis of 0.6-3.0 mmol/l is not possible, and the proposed benefits cannot be accessed.
This challenge is even greater for the person with type 1 diabetes. Because the person with type 1 diabetes infuses insulin into the peripheral tissues rather than secreting it directly from the beta-cells of the pancreas, the direct inhibition of glucagon release from the alpha-cells is less effective. A higher insulin level is needed to achieve the same result, and that higher circulating insulin is even more effective at stopping the liver and kidneys from producing ketones.
Therefore, the protein level cut-offs need to be lower for people with type 1 diabetes who want to achieve nutritional ketosis (0.6-3.0 mmol/l):
- For non-active people: 0.8-1.0 g/kg (0.3-0.4 g/lb)
- For very active people: 1.2-1.5 g/kg (0.5-0.7 g/lb)
So in simple terms, if a person with type 1 diabetes wants to get into nutritional ketosis, they need a lower protein intake and higher fat intake. This may not be ideal for maintaining lean muscle mass in an energy-restricted phase.
Bottom line: if you want a true ketogenic diet with blood ketones consistently at 0.6-3.0 mmol/l, you need to keep protein at less than 1.5 g/kg (0.7 g/lb) and have a fat intake of at least 75% of total energy. And you need to test your blood ketones, not guess.
How I Insulin Dosed for Each Diet
Insulin dosing for the different diet types created a unique challenge.
One thing is certain: carbohydrate counting alone did not work across the different macronutrient splits.
Taking a deep dive into the research and science is beyond the scope of this write-up. That information can be found in the Ultimate Guide to Insulin Dosing.
Results
I wanted to see what would happen over the 120 days to:
- Diabetes management and insulin requirements
- Metabolic markers
- Exercise performance
- Body composition
Diabetes management and insulin requirements
| Before change | After HCLF (0-40 days) | After LCHF (40-80 days) | After KETO (80-120 days) | |
|---|---|---|---|---|
| Predicted HbA1c% from sensor glucose | 6.5% | 6.3% | 5.1% | 5.5% |
| Average blood glucose (mmol/l) | 8.5 mmol/l | 8.0 mmol/l | 6.2 mmol/l | 6.1 mmol/l |
| Standard deviation | 3.5 mmol/l | 3.1 mmol/l | 1.8 mmol/l | 1.3 mmol/l |
| Number of hypos (<3.5 mmol/l) per week | 5 | 4 | 2 | 1 |
| Total daily insulin (units) | 45 units | 38 units | 25 units | 18 units |
| Total daily basal insulin (units and % TDD) | 18 units (40%) | 15 units (39%) | 15.5 units (62%) | 11 units (61%) |
| Total daily bolus insulin (units and % TDD) | 27 units (60%) | 23 units (61%) | 9.5 units (38%) | 7 units (39%) |
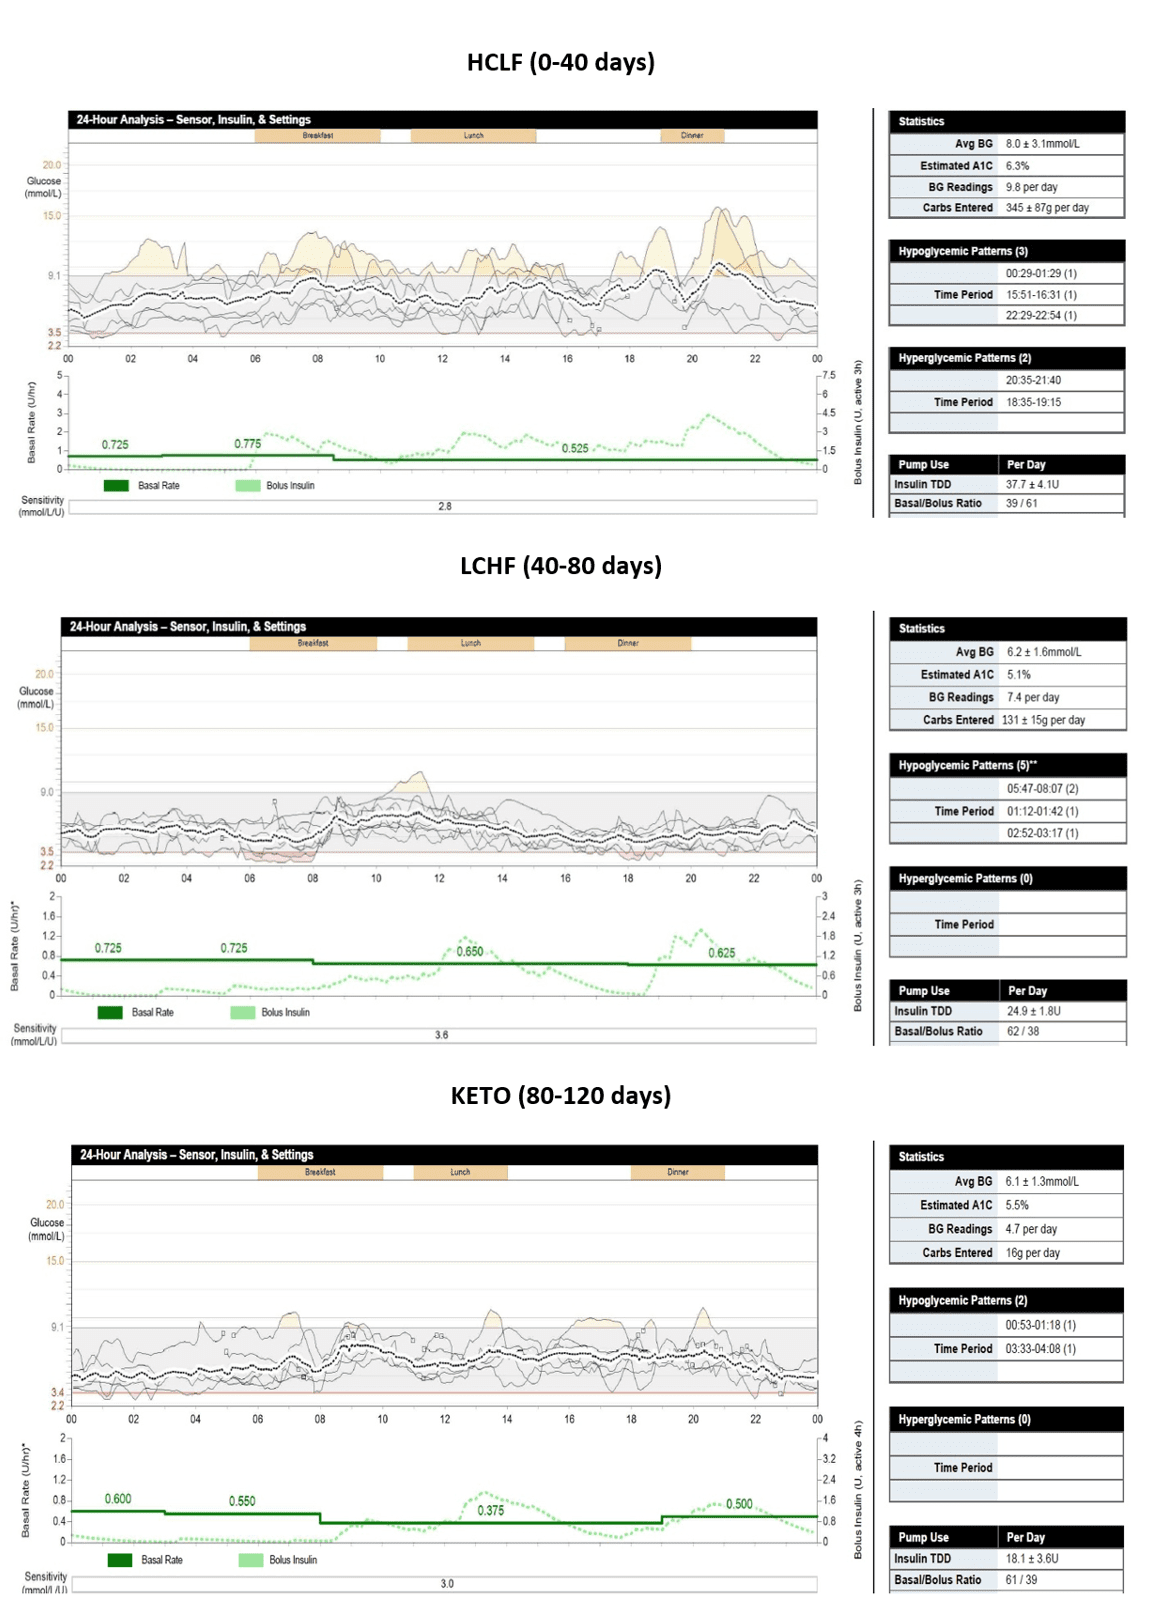
The experiment clearly shows: the lower the daily carbohydrate intake, the easier my blood glucose was to keep in target.
This was mainly due to never having a high amount of bolus insulin in the system at any one time. The lower the bolus insulin, the less chance of a quick drop in glucose. The less carbohydrate, the less chance of spikes.
Put simply: smaller inputs, smaller outputs.
Interestingly, I enjoyed the majority of the benefit in glucose management by dropping from 345 g a day to 131 g a day. There was only a slight further benefit by dropping from 131 g to 16 g a day.
Metabolic markers
| Before | After HCLF (0-40 days) | After LCHF (40-80 days) | After KETO (80-120 days) | |
|---|---|---|---|---|
| Blood pressure (systolic/diastolic) | 140/80 | 135/75 | 130/70 | 123/70 |
| Triglycerides (ideal <1.7 mmol/l) | 1.3 mmol/l | 1.0 mmol/l | 1.0 mmol/l | 1.0 mmol/l |
| Total cholesterol (ideal <5.0 mmol/l) | 5.9 mmol/l | 4.8 mmol/l | 7.3 mmol/l | 8.6 mmol/l |
| LDL (ideal <3.0 mmol/l) | 4.1 mmol/l | 3.2 mmol/l | 4.6 mmol/l | 5.4 mmol/l |
| HDL (ideal >1.0 mmol/l) | 1.3 mmol/l | 1.5 mmol/l | 2.2 mmol/l | 2.7 mmol/l |
| TC:HDL ratio (low <3.5, medium to 5.0, high >5.0) | 4.5, medium | 3.2, low | 3.3, low | 3.2, low |
| HDL:LDL ratio (low >0.4, medium 0.3, high <0.2) | 0.3, medium | 0.4, low risk | 0.47, low risk | 0.5, low risk |
| TG:HDL ratio (low <0.87, medium to 1.74, high >2.62) | 0.77, low | 0.66, low | 0.45, low | 0.37, low |
Blood pressure dropped progressively and finished in the optimal range, which is what would be expected with improved body composition.
Highlights from the lipid results:
- Triglycerides remained stable and at a low-risk level throughout.
- HDL increased progressively with energy restriction and body fat loss.
- There was a big increase in HDL when carbohydrate decreased, in line with evidence showing insulin reduces HDL production by the liver.
- All risk ratios (TC:HDL, HDL:LDL, TG:HDL) improved as energy was restricted and body fat was lost.
- The TG:HDL ratio reduced significantly, this ratio is regarded as a strong predictor of coronary heart disease risk in large cohort studies.
The concerns:
- Total cholesterol was already at 5.9 mmol/l before the experiment. My paternal grandfather died of cardiovascular disease and my father had a recent total cholesterol of 9.0 mmol/l, there are genetic elements at play here. This result ultimately led to a diagnosis of Familial Hypercholesterolaemia and the start of lipid-lowering therapy. Total cholesterol did drop with weight loss and energy restriction in the first 40 days of HCLF, but then increased as carbohydrate decreased and fat increased, reaching a potentially concerning 8.6 mmol/l by day 120.
- LDL cholesterol increased consistently as carbohydrate intake decreased and fat increased, undoubtedly influenced by the undiagnosed Familial Hypercholesterolaemia. This is why testing lipids before embarking on any radical dietary regimen is important.
Exercise performance
| Before change | After HCLF (0-40 days) | After LCHF (40-80 days) | After KETO (80-120 days) | |
|---|---|---|---|---|
| Back squat, 8 reps | 140 kg | 140 kg | 135 kg | 130 kg |
| Dumbbell chest press, 8 reps | 100 kg | 100 kg | 95 kg | 90 kg |
| Pull-ups, strict form | 12 | 11 | 10 | 9 |
| HIIT session (pre-experiment = 100%) | 100% | 95% | 85% | 70% |
Key observations:
- A progressive drop in strength across the dieting phase, to be expected with prolonged dietary restriction. During KETO, in the third and fourth sets of compound lifts such as deadlifts and squats, I felt completely empty. Not a feeling I enjoyed at all.
- The HIIT results were the most striking. By the end of 120 days, I could only complete 70% of my usual work. Some of this will have been due to prolonged dieting, and some likely due to reduced glycogen storage. I believe the lack of carbohydrate impacted performance well above and beyond energy restriction alone, but I acknowledge I could be biased, and re-running the experiment in reverse order would be the only way to confirm this.
- It was also my cricket season during the LCHF and KETO periods. During LCHF I felt ok in the field for three hours. During KETO I felt very lethargic and it seriously impacted performance. Again, in my view, primarily due to carbohydrate restriction rather than energy restriction alone.
Body composition
| Before change | After HCLF (0-40 days) | After LCHF (40-80 days) | After KETO (80-120 days) | |
|---|---|---|---|---|
| Weight (kg), average morning weight from at least 3 measurements | 100 kg | 97 kg | 95.5 kg | 91.8 kg |
| Body fat from 7-site skin callipers (mm) and % drop from previous phase | 98 mm | 72 mm (27%) | 50 mm (30%) | 37 mm (26%) |
| Body fat % estimated from 7-site calliper measurements | 15% | 11% | 8% | 5.7% |
| Fat mass (kg) and % drop from previous phase | 15 kg | 11 kg (27%) | 8 kg (28%) | 5.4 kg (33%) |
| Fat-free mass (kg) | 85 kg | 86 kg | 87.5 kg | 86.4 kg |
| Waist circumference (cm) and % drop from previous phase | 98 cm | 92 cm (7%) | 86 cm (7%) | 84 cm (3%) |
Highlights:
- Fat mass dropped consistently from approximately 15 kg to approximately 5 kg.
- Lean mass held fairly steady, thanks to consistent strength training.
- Waist circumference shrank consistently across all three phases.
- Energy restriction is the driver of body composition change, not macronutrient breakdown.
What I Took Away
Looking back, this experiment wasn’t just data, it was lived reality. And that’s the bit that matters most when you’re trying to translate science into actual life with diabetes.
Some of my biggest personal takeaways:
- Building a handful of consistent, repeatable meals is the key to predictable glucose, regardless of macro split.
- Protein matters. On lower-carb plans, it still impacts glucose and needs to be accounted for in insulin dosing.
- Glucose management tends to improve with lower carbs, but exercise performance at high intensities may suffer at the extremes.
- Keto isn’t keto unless protein is kept below the threshold and ketones are consistently measured. Most “keto diets” out there are really just low-carb.
- Lipids need monitoring. Energy restriction improved some ratios, but high fat intake can raise cholesterol significantly, particularly in those with underlying genetic risk.
- Fat loss came from the calorie deficit, not from carbs versus fat as a category.
Final Word
The 120-day carb experiment showed me that you can make any macro split work, but the trade-offs are different. High-carb required constant micromanagement. Low-carb reduced stress but cut exercise performance. Keto simplified boluses but wasn’t sustainable socially, physically, or even physiologically without major sacrifices.
Take home
At the end of the day, the best diet is the one you can actually live with. Why not experiment to find your sweet spot, your CGM is the feedback tool that can tell you what’s really happening.