
Reminder, for insulin dosing decisions, we only have sufficient data for a small number of CGM systems.
To be clear, risk assessment always comes first, with no free passes. For a deeper explanation (not needed for most), see CGM Black Swan.
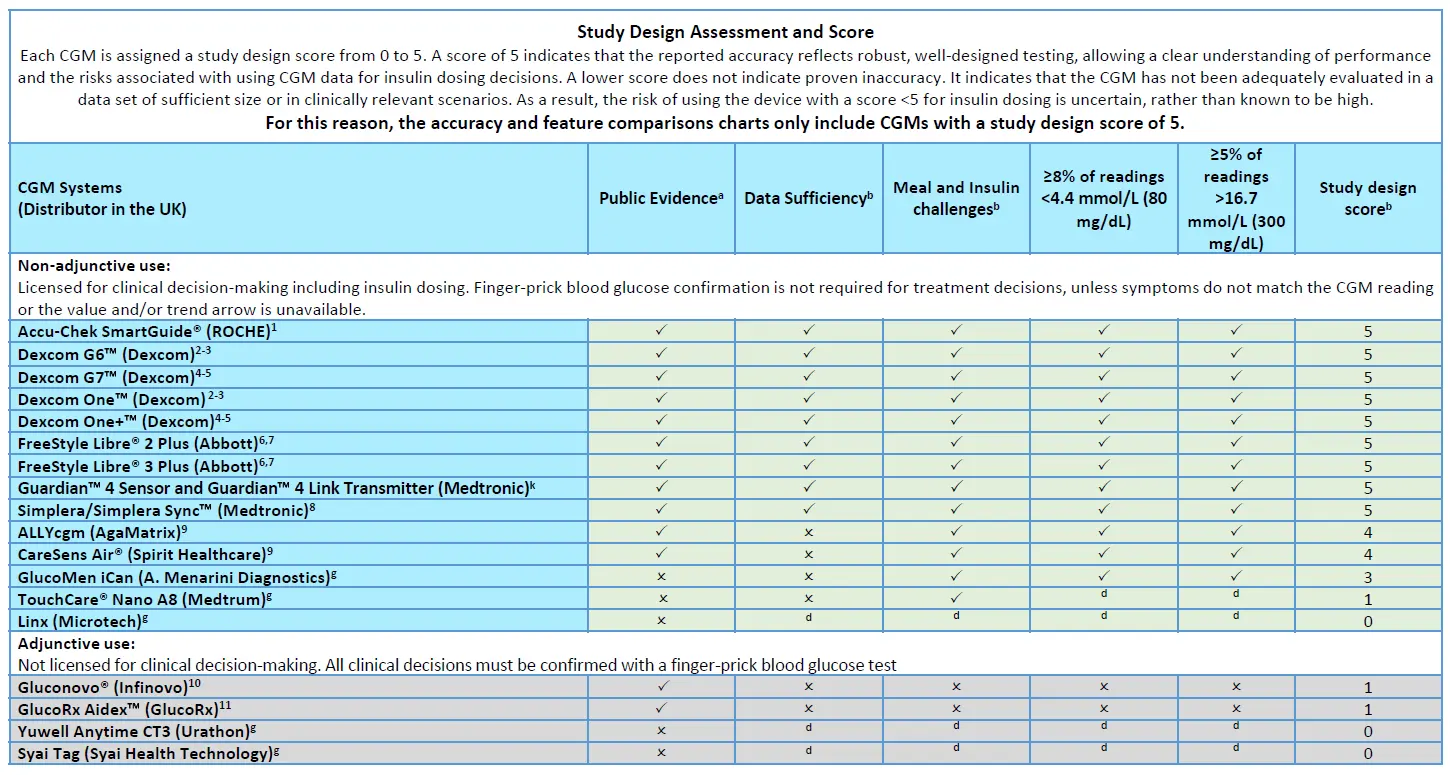
Therefore, we only discuss CGM accuracy for these CGMs:
- Accu-Chek SmartGuide
- Dexcom G6
- Dexcom One
- Dexcom G7
- Dexcom One+
- EverSense
- FreeStyle Libre 2 and 2 Plus
- FreeStyle Libre 3 and 3 Plus
- Medtronic Guardian 4
- Medtronic Simplera
TL;DR
Performance metrics – why averages can mislead
There are lots of accuracy metrics, each with limitations. The most common is MARD (Mean Absolute/Relative Difference), which gives an overall average error. But an “average” tells you very little about risk at the extremes — where clinical decisions matter most.

Agreement rates: 20/20 and 40/40
Agreement rates show the percentage of readings that fall within an acceptable error range, typically:
- 20/20 – Within this, no clinical risk
- 40/40 –Outside this, high clincial risk

A reading is within the 20/20 zone if:
- For CGM values < 5.5 mmol/L (100 mg/dL), the comparator is within ±1.1 mmol/L (±20 mg/dL).
- Example: CGM = 4.5 mmol/L (80 mg/dL). The “true” value must be between 3.4–5.6 mmol/L (60–100 mg/dL).
- For CGM values ≥ 5.5 mmol/L (100 mg/dL), the comparator is within ±20%.
- Example: CGM = 10.0 mmol/L (180 mg/dL). The reference must be 8.0–12.0 mmol/L (144–216 mg/dL).
The higher the % of readings within 20/20, the more dependable the CGM is for low-risk insulin dosing.
The 40/40 metric is a wider safety net that helps flag readings with a high chance of leading to incorrect insulin decisions.
- For CGM values < 5.5 mmol/L, the comparator must be within ±2.2 mmol/L (±40 mg/dL).
- Example: CGM = 4.5 mmol/L (80 mg/dL) → reference must be 2.3–6.7 mmol/L (20–120 mg/dL).
- For CGM values ≥ 5.5 mmol/L, the comparator must be within ±40%.
- Example: CGM = 10.0 mmol/L (180 mg/dL) → reference must be 6.0–14.0 mmol/L (108–252 mg/dL).
If a CGM frequently fails even the 40/40 window, those readings are very likely to cause incorrect dosing decisions.
Important: because different CGMs are calibrated and tested differently, the same 20/20 or 40/40 percentage does not always mean the same real-world accuracy.
How do the CGM systems stack up?
The DSN Forum UK CGM comparison charts .
The first comparison tells us which CGMs have a study design score of 5, so we know they have been assessed thoroughly.
The second chart summarises study design scores and 20/20 and 40/40 agreement rates for the CGMs with a study design score of 5.
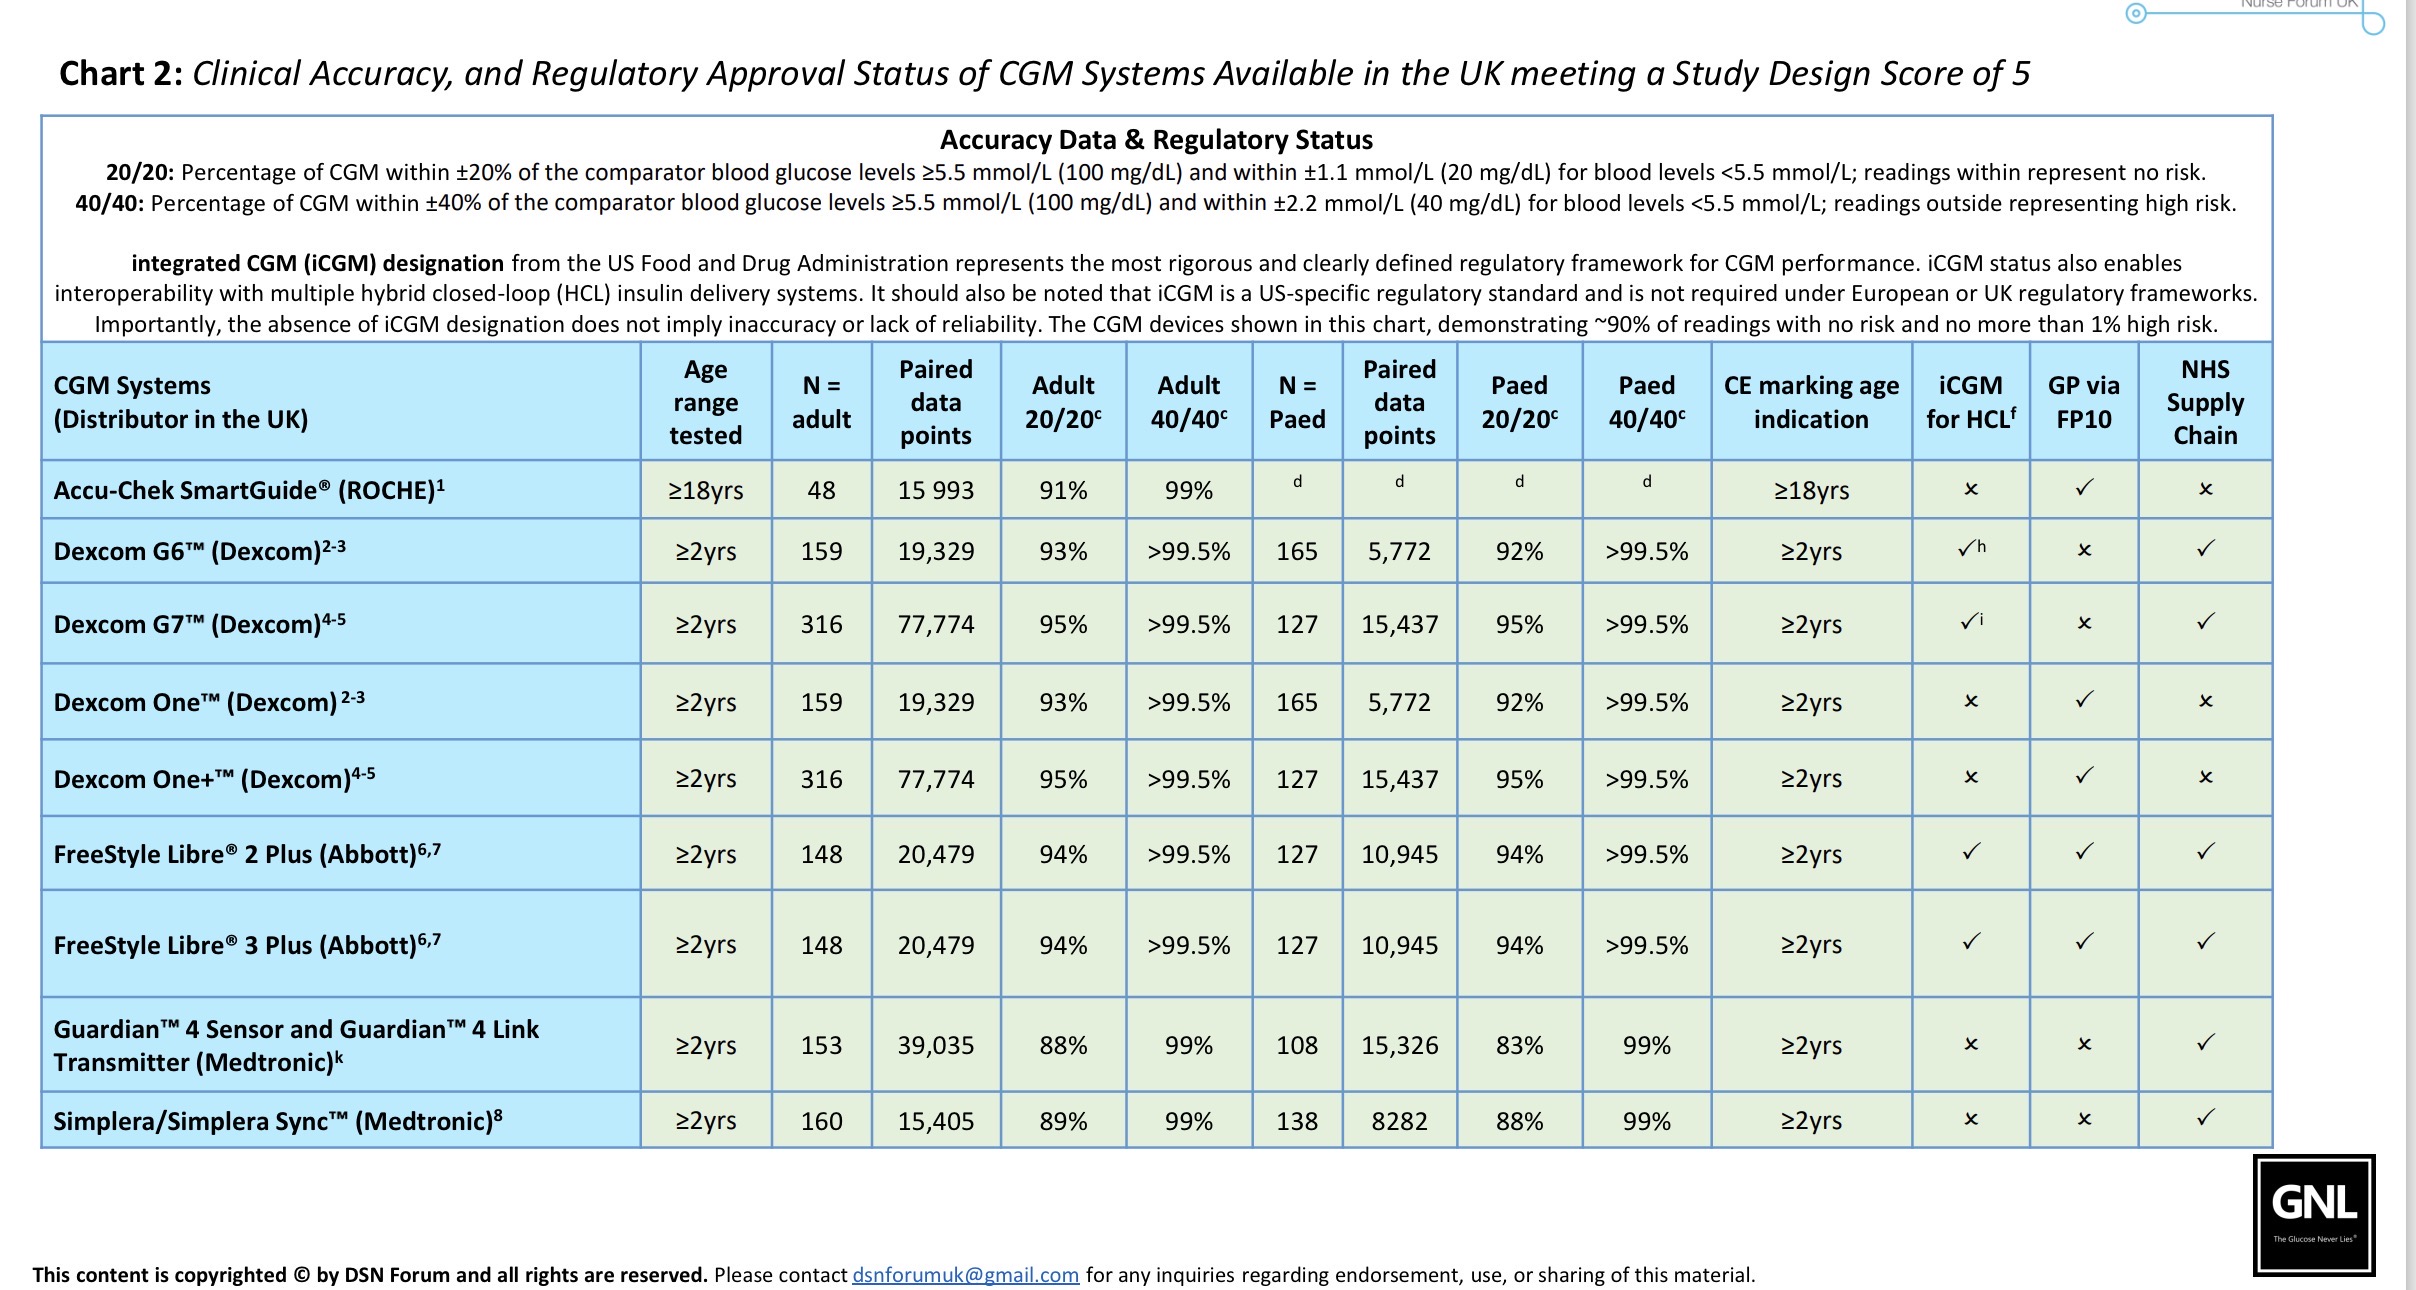
If a CGM:
- Has a study design score of 5, and
- Achieves around 90% of readings within 20/20, and
- Has ≥ 99% within 40/40,
…then it can support insulin dosing decisions with a low rate of high-risk outliers. All of the CGM systems mentioned on this page meet this criterion.
However, this still leaves around 0.5–1% of readings that may be problematic. This is why occasional cross-checking with an ISO-standard blood glucose test will always be necessary, and why understanding the CGM black swan problem is so important.
Those with iCGM approval are the most accurate and have the greatest depth of data. That’s the Abbott, Dexcom and Eversense CGM systems.
What’s next?
They are in order, but take your pick:
Thank you for your amazing work, so interesting and so clear to a non-medical audience! I wanted to mention another important factor with CGMs now that we are in the era of widespread AID system use – connectivity. Many of us have recently had to switch to the Libre2+ for cost reasons. It is CE marked to work with the Omnipod, and they seem to have obtained this approval on the basis of equivalence with the Dexcom G6, but in fact the connectivity is not at all the same. Many of us experience signal loss issues (I’ve seen two people report just this week that this landed them in hospital with DKA). For me that has been only an inconvenience, but I was alarmed to be informed by Insulet that I should only use my pod on the same arm as a sensor, no other sites are reliable. So no real site rotation. I can put them above and below a sensor, but I worry about the longer term impact of this. Please could you look into this for us? Your patients may be facing similar issues.
🙏🏻
Hi Emma, I hear what you are saying. I will look to include this in the upcoming CGM Series. Thanks for the kind words! X