
GlucoseGo + GlucoseLo: The Two Sides of the Exercise Coin
Exercise in type 1 diabetes has been taught as a risk: risk of hypoglycaemia, risk of unpredictability, risk of “losing control”.
But the evidence base now supports a cleaner framing: exercise becomes predictable when you prioritise the variables that actually drive glucose change — and those same variables can be used both to prevent exercise-induced hypos and to lower high glucose on purpose.
The team behind the models
The analytical architecture behind GlucoseGo and GlucoseLo was led by data scientist extraordinaire Dr Catherine Russon, whose work translates large-scale CGM datasets into practical, real-world decision tools. The elegance of these tools is not that they are simple. It is that the complexity has already been handled underneath.

This modelling work was developed with the help of the teams at Exeter (Rob Andrews,Michael Allen, Emma Cockcroft, Neil Vaughan, Richard Pulsford & Brad Metcalf), Oxford (Anne-Marie Frohock), and Birmingham (John Pemberton) — combining data science, clinical physiology, and translational diabetes care into tools that are both statistically rigorous and clinically usable.
None of this work exists without the T1DEXI Initiative — one of the most important real-world exercise datasets ever collected in type 1 diabetes. Over 20,000 structured exercise events from nearly 1,000 people with T1D have fundamentally changed how we understand glucose behaviour during activity, moving us away from theory and towards physiology-driven decision making.
Funded by the Leona M. and Harry B. Helmsley Charitable Trust, spearheaded by Prof Mike Riddell (York Uni, Canada) and Dr Robin Gal (JAEB, US) amongst other great people (Peter Calhoun and Zoey Li of the JAEB, US) the programme has produced a series of landmark publications — but the flagship paper stands out as essential reading if you want to understand what actually happens to glucose when real people move in the real world.
The four variables that matter
Across Glucose Go (hypoglycaemia risk prediction during exercise) and Glucose Load (using activity to lower hyperglycaemia), glucose behaviour is dominated by four variables:
- Starting glucose
- Rate of change (trend arrows)
- Duration
- Insulin on board (IOB)
Everything else is secondary. Exercise type and intensity matter, but they come after the majors.
This aligns directly with the GNL exercise guide principle: Major in the majors — because most exercise volatility is predictable from starting conditions.
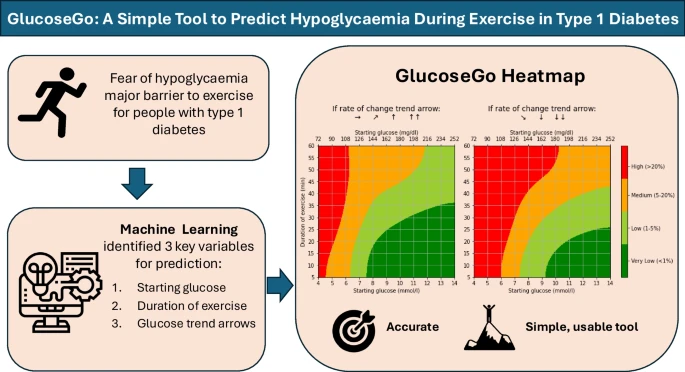
Glucose Go: preventing exercise hypoglycaemia
Glucose Go is the simplest high-output tool for predicting hypoglycaemia risk during exercise. It’s designed for rapid, real-world decision making and works particularly well for typical activity bouts up to ~60 minutes.
Read the paper here: GlucoseGo (Diabetologia).
How to use the GlucoseGo charts
These charts allow you to calculate hypoglycaemia risk for exercise sessions up to 60 minutes in duration.
Risk ranges from very low (<1%) to high (>20%), based on just three inputs:
- Your starting glucose value
- Your trend arrow
- Your planned duration of activity
That’s it. No complex modelling required at the bedside. The heavy lifting has already been done underneath.
If you do not have CGM and therefore do not have a trend arrow, use the chart assuming a downward trend to stay on the safe side. This provides a conservative estimate of risk.

Once risk is defined, the response is usually simple: carbohydrate and/or insulin reduction strategy — chosen based on timing.
Carbohydrate support: use the calculators
If hypoglycaemia risk is elevated, you’ll usually need extra carbohydrate. That’s why we built CGM-specific exercise carbohydrate calculators:
- Download: Dexcom Exercise Carbohydrate Calculator (PDF)
- Download: Libre Exercise Carbohydrate Calculator (PDF)
- Download: Medtronic Exercise Carbohydrate Calculator (PDF)
IOB matters — but trend arrows capture most of it
IOB is physiologically important because activity amplifies insulin action. But IOB is also a hard metric to “know” in real life: displays often simplify insulin action (commonly assuming a 4-hour linear decay), which can underestimate real insulin effect and individual variability.
That’s why in practice, starting glucose + trend arrows often capture most of the insulin state you need for decision-making. Trend arrows are the real-time readout of net insulin effect, food absorption, sensitivity and counter-regulation.
So the practical takeaway is:
- IOB still matters (it amplifies drops and hypo risk)
- but trend + starting glucose often provide the best real-time signal
- and adding duration completes the most usable model for most sessions
So, how should we think about IOB?
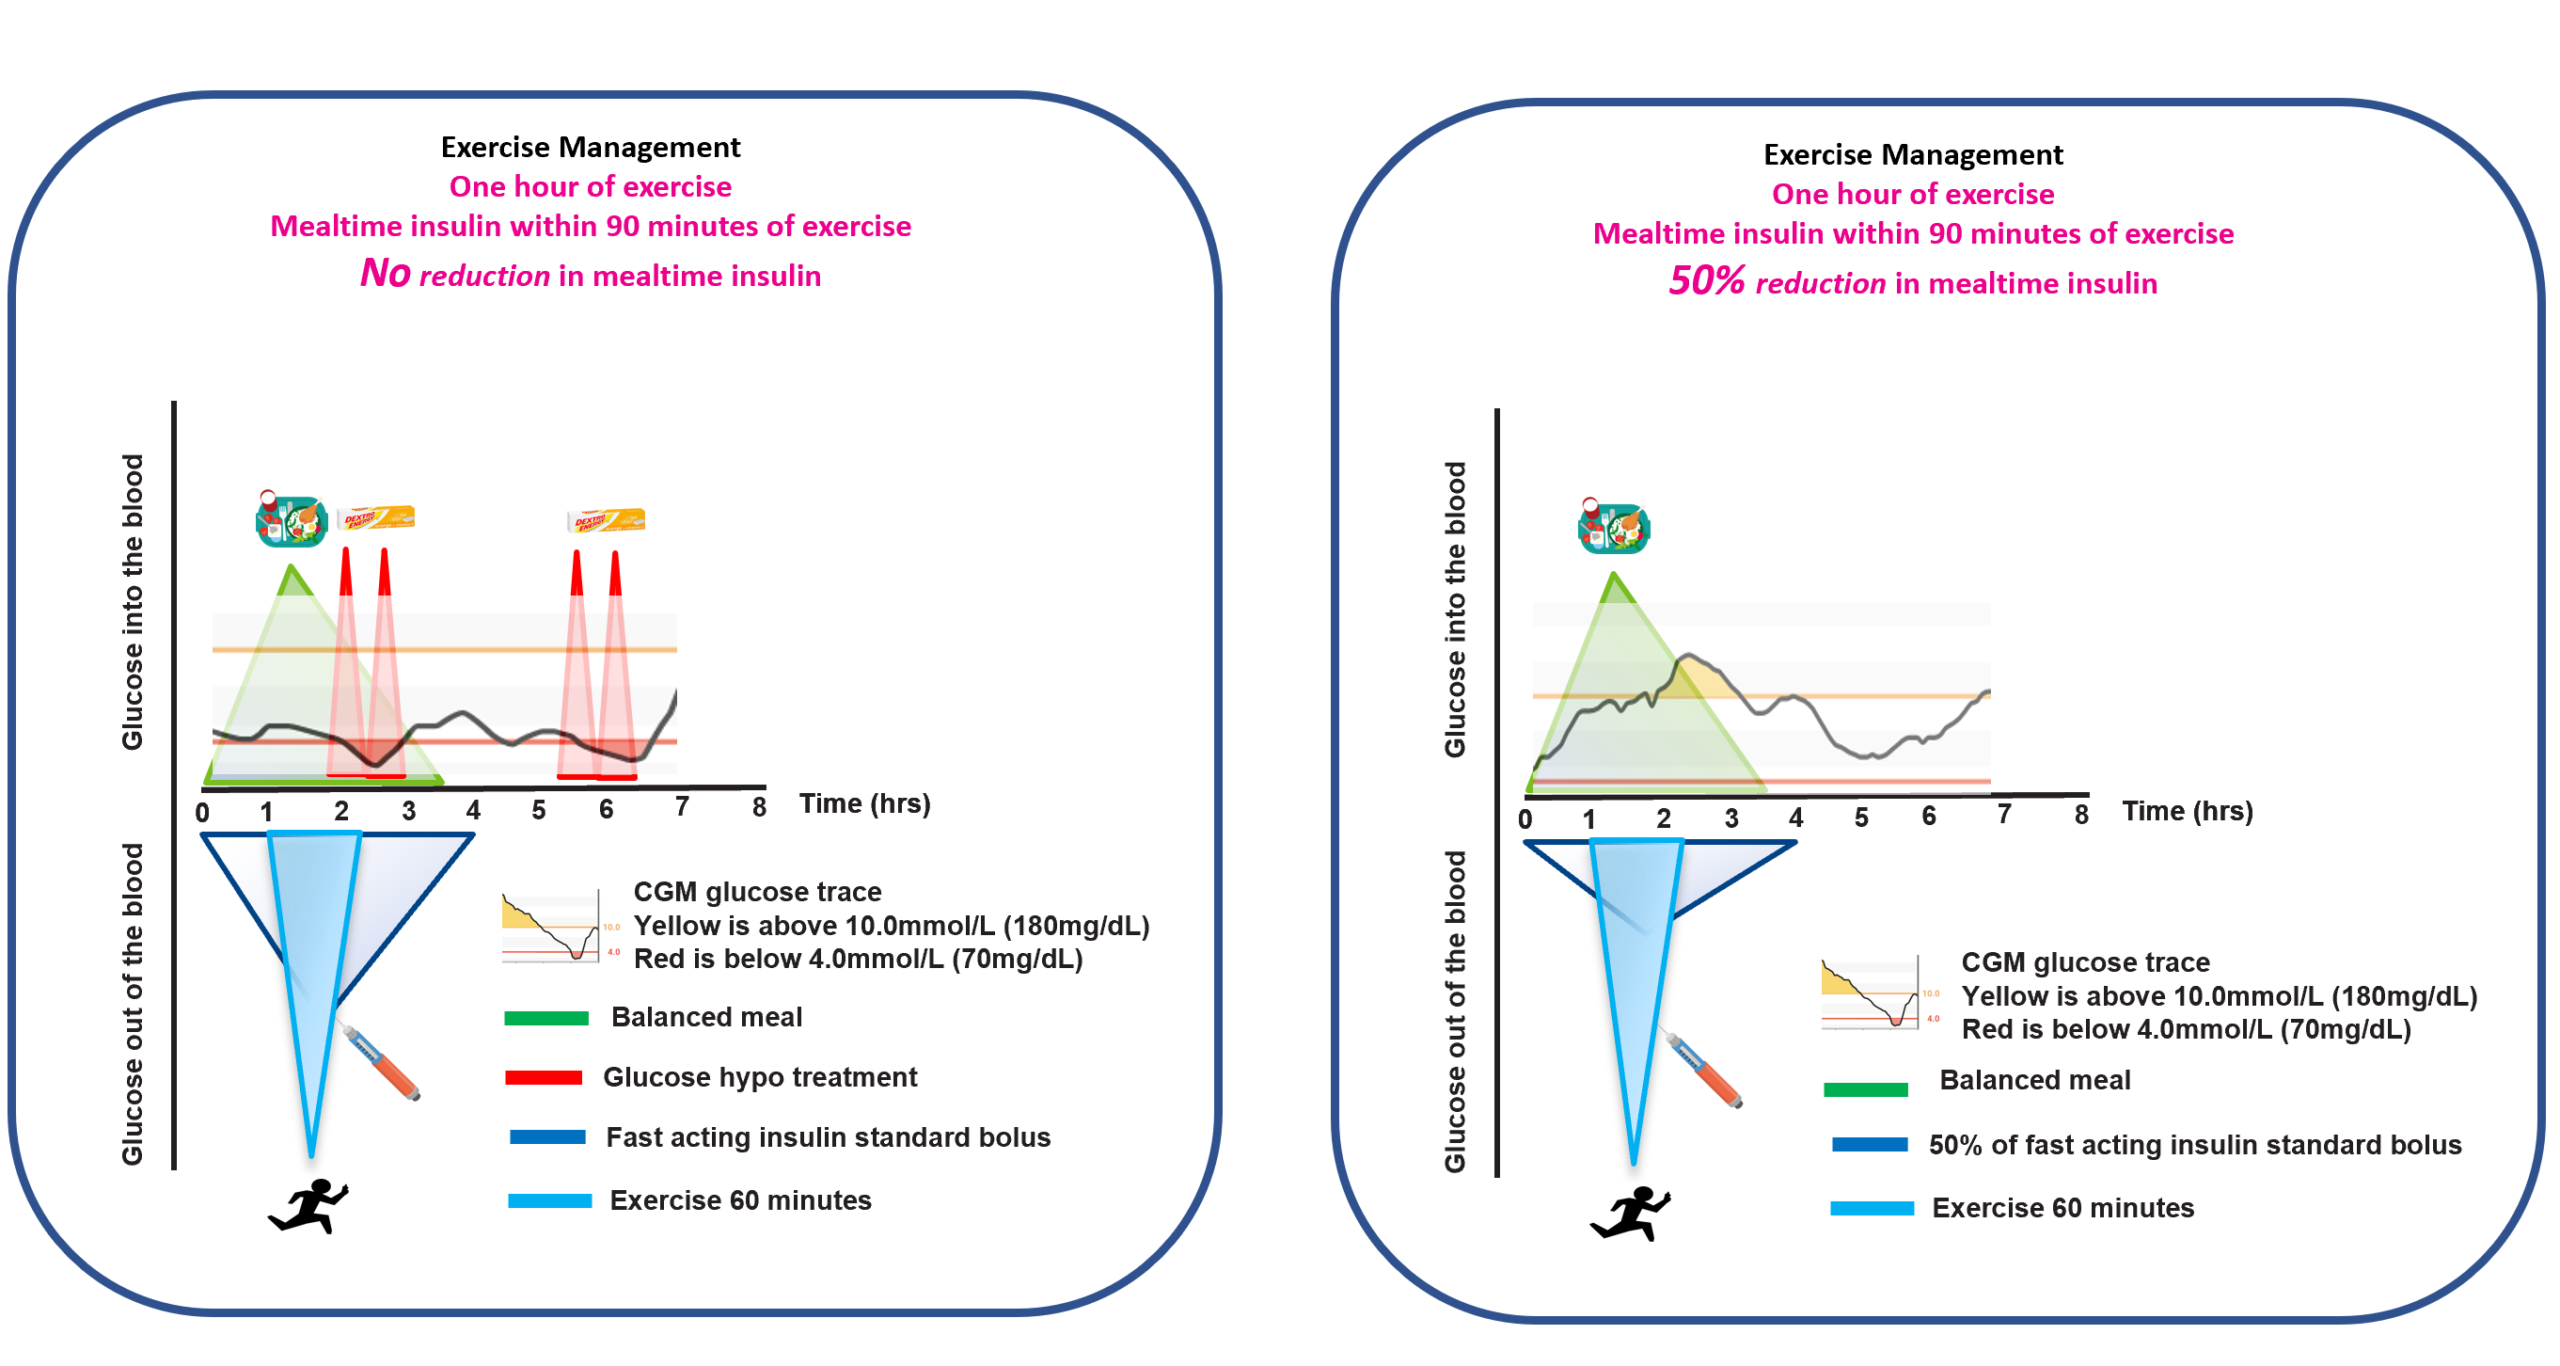
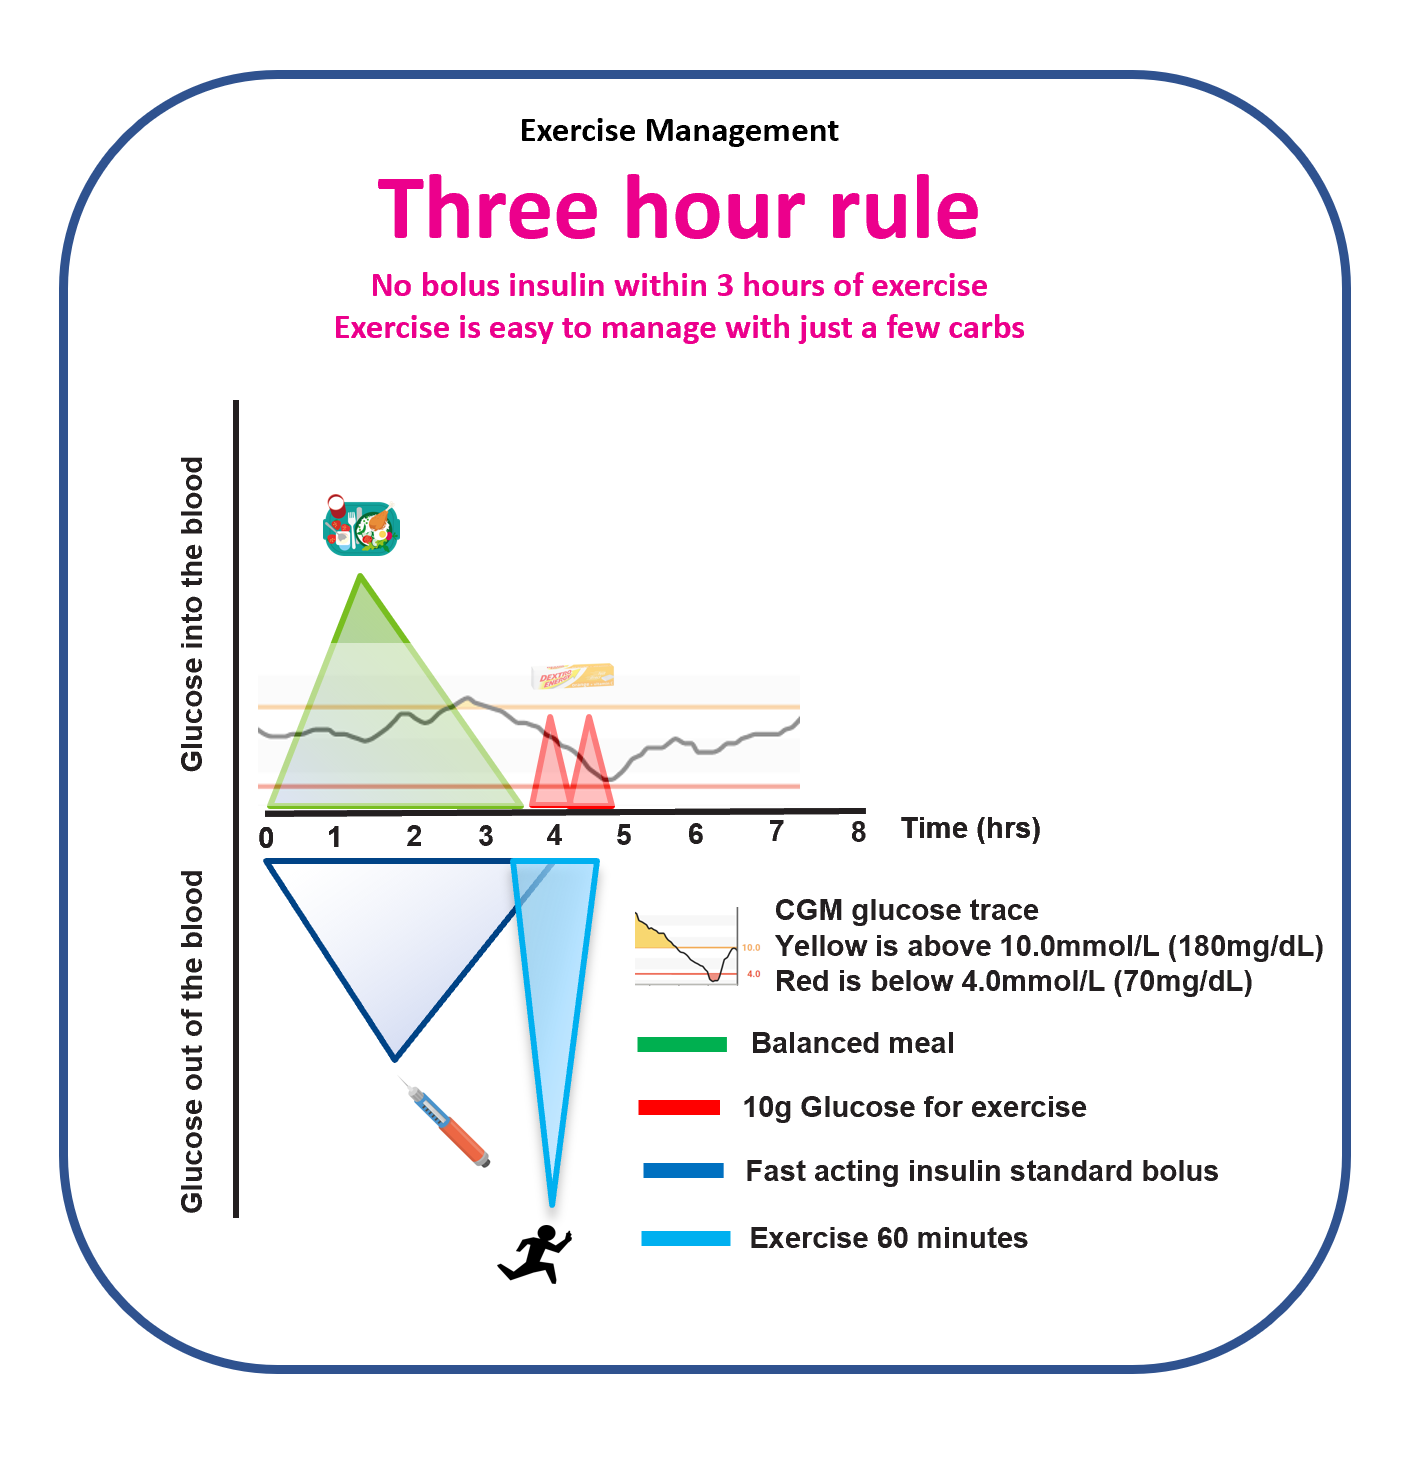
The 90-minute window and the Three-Hour Rule
Carbohydrate manages risk in the moment. Insulin reduction manages risk upstream. Two heuristics capture a huge amount of real-world variation:
- The 90-minute window: exercise soon after a meal bolus often overlaps peak insulin action (higher hypo risk without adjustments).
- The Three-Hour Rule: when the last bolus was ~3 hours before exercise, glucose behaviour is often more predictable.
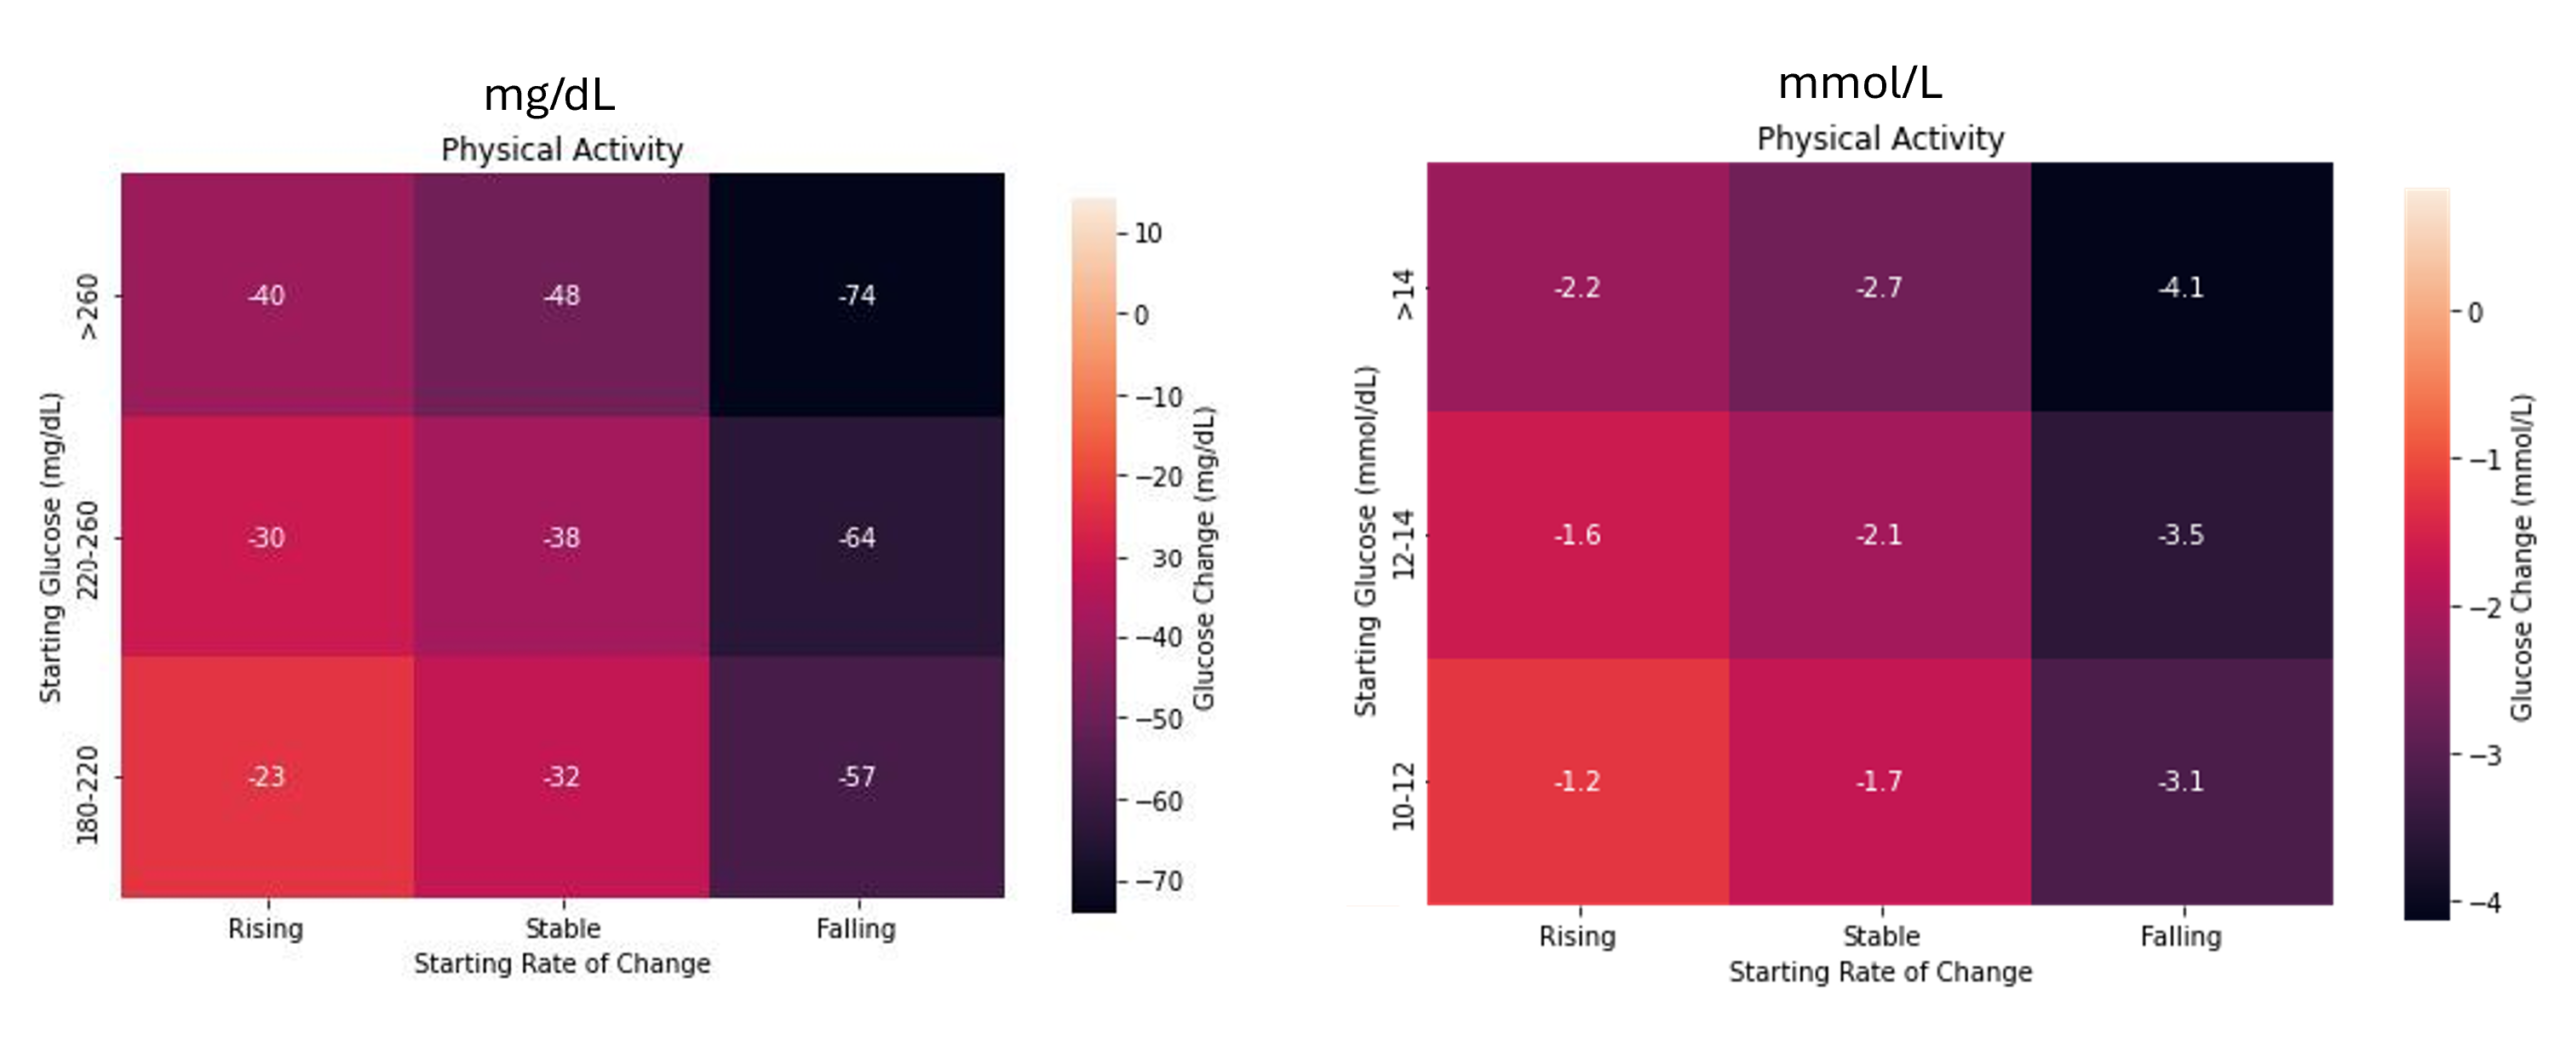
Glucose Lo: using activity to lower high glucose
Now flip the model.
Glucose Lo uses the same starting conditions to show that short bouts of activity can safely and effectively lower glucose when it’s high — turning exercise into a fast-acting, non-pharmacologic correction tool.
Read the causal matching analysis here: GlucoseLo — causal matched-pairs analysis
Read the summary article here: GlucoseLo — summary article
How to use GlucoseLo in practice
In short: when glucose is above 10.0 mmol/L (180 mg/dL) and a bolus insulin dose has been given within the previous 4 hours, a short bout of activity (10–30 minutes) can lower glucose rapidly — with very low hypoglycaemia risk.
For practical teaching, this simplifies cleanly to:
20 minutes → ~2 mmol/L drop (≈40 mg/dL)
We’ve created take-home 20 by 2 / 20 by 40 guides in mmol/L and mg/dL — for clinics, teaching, and personal use.
This is not a guarantee. It is a robust starting heuristic that works well for education and real-world decision making.
If you want a more precise estimate, use the GlucoseLo heatmaps to predict expected drop based on your starting glucose level and trend arrow.
One framework that covers both directions
Put simply:
- GlucoseGo helps you prevent exercise hypoglycaemia by predicting risk from starting conditions.
- GlucoseLo helps you use short activity bouts to lower high glucose using the same starting conditions.
Same variables. Two intents. And both reinforce the central rule of exercise management:
Always check your starting glucose and trend before you start.
Add duration and some IOB awareness, and you can capture most of the hypoglycaemia risk and most of the glucose-lowering potential — then manage the remaining risk with carbohydrate and/or insulin timing rules.
Next step:
This article is the evidence spine. The full playbook (exercise types, AID considerations, FAQs, and practical examples) lives here:
Exercise and Type 1 Diabetes — Practical Guide
Related Podcasts