
Insulin Resistance Guide — Part 1
Introduction: Overcoming Insulin Resistance with T1D
Insulin resistance is often framed as a type 2 issue. In type 1 diabetes, it matters just as much — because when insulin becomes less effective, glucose control becomes harder, insulin requirements creep up, and the whole system becomes noisier and more volatile.
About this guide
This is a practical, mechanism-first framework for understanding why insulin stops working as well over time in type 1 diabetes — and what can realistically be done about it. It is deliberately more technical and conceptual than many GNL guides, because insulin resistance is a systems problem: liver, muscle, fat, kidney, brain, gut hormones, and glucagon all pulling on the same rope.
This is informational education, not individual medical advice. Several interventions discussed in later parts can require immediate insulin adjustment. Without pre-planned dose changes, hypoglycaemia risk can rise sharply.
Why insulin resistance matters in type 1
Evidence suggests that as insulin resistance increases, the risk of cardiovascular events and all-cause mortality rises in a dose–response manner in people living with type 1 diabetes. This is not just about glucose numbers — it is about long-term metabolic health.
Why type 1 is uniquely exposed
People with type 1 diabetes do not produce insulin from the pancreas — but that does not make them immune to insulin resistance. The route of insulin delivery creates unique challenges.
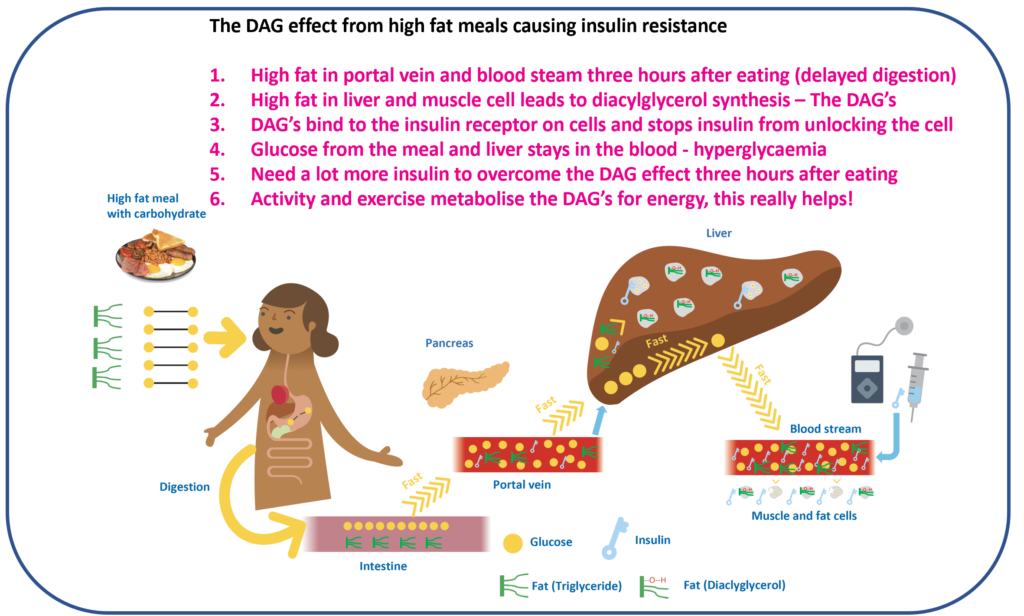
In people without diabetes, insulin is released directly into the portal vein, reaching the liver first. The liver gets first access to insulin, which helps shut down unnecessary glucose output and store incoming meal glucose efficiently. Peripheral insulin exposure (muscle and fat) remains relatively low.
In type 1 diabetes, insulin is delivered into subcutaneous tissue, not the portal vein. That reverses the natural gradient:
- The liver can be under-insulinised — so it keeps producing glucose when it should not, contributing to glucotoxicity
- Peripheral tissues can be over-insulinised — muscle and fat see more insulin than nature intended, which can promote fat storage and metabolic dysfunction
This liver–periphery mismatch is one reason insulin resistance can become a bigger practical problem in type 1 diabetes than most people appreciate.
The Ominous Octet framework
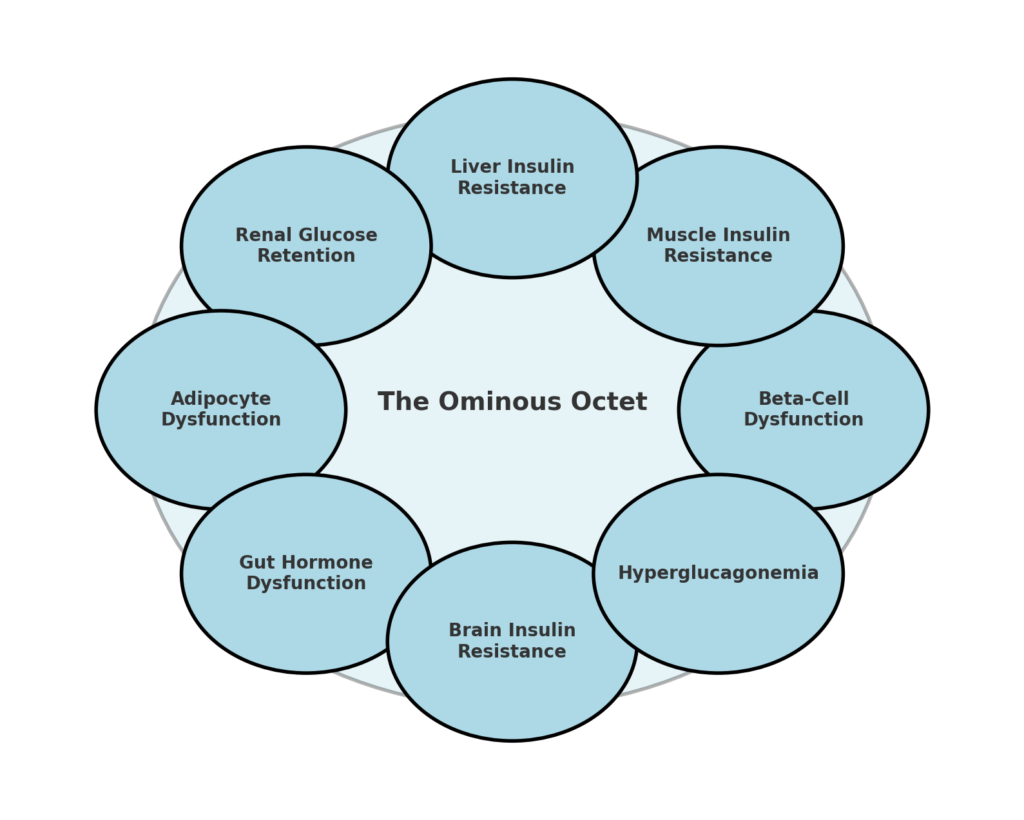
This guide uses the Ominous Octet framework originally developed by Dr Ralph DeFronzo — eight dysfunctions that collectively drive insulin resistance and glucose dysregulation. Although the Octet is typically taught in the context of type 2 diabetes, most of its principles also apply in type 1. The point is not to relabel type 1 as type 2 — it is to understand which biological levers are actually moving your insulin requirement.
For a deep dive, the original masterclass is essential listening: Attia #337 — Ralph DeFronzo on insulin resistance.
Defining insulin resistance in type 1
The gold standard research method is the hyperinsulinaemic–euglycaemic clamp, but it is not practical for everyday clinical use. In type 2 diabetes, insulin resistance is often inferred using fasting insulin or HOMA-IR. In type 1 that approach breaks, because endogenous insulin production is absent or very low.
In practice, insulin resistance in type 1 diabetes is commonly approximated using total daily insulin per kilogram (U/kg) — imperfect, but useful as a signal, especially tracked over time.
What insulin-sensitive looks like in numbers
In a healthy adult without diabetes, the body produces roughly 35 units of insulin per day. That is a rough reference point for high insulin sensitivity. For adults living with type 1 diabetes, typical total daily insulin requirements range from about 0.4 to 1.0 U/kg, but can be higher (sometimes up to 2.0 U/kg in more insulin-resistant states).
Adult framing (estimated from DCCT data)
- <0.4 U/kg — very insulin sensitive (approximately 14%)
- 0.4–0.5 U/kg — insulin sensitive (approximately 11%)
- 0.5–0.7 U/kg — insulin resistance emerging (approximately 30%)
- 0.7–1.0 U/kg — significant insulin resistance (approximately 35%)
- >1.0 U/kg — high insulin resistance (approximately 9%)
Adolescent framing (ages 12–18, imputed from German DPV data)
- <0.4 U/kg — very insulin sensitive (approximately 2%)
- 0.4–0.6 U/kg — insulin sensitive (approximately 11%)
- 0.6–0.8 U/kg — insulin resistance begins (approximately 29%)
- 0.8–1.2 U/kg — significant insulin resistance (approximately 53%)
- >1.2 U/kg — high insulin resistance (approximately 5%)
These categories are not a moral scoreboard
They are a signal. The better question is: what is the next winnable step from where you are now? Do not sacrifice glucose control just to reduce insulin use. Lowering insulin at the expense of higher glucose levels is rarely a worthwhile trade-off.
Total daily insulin is influenced by many factors — age, puberty, sleep, illness, medications, weight distribution, ethnicity, gender, residual C-peptide, and more. This guide reports common patterns; they still need to be interpreted for individual circumstances.
Why fat loss can feel like a trap in type 1
In type 1 diabetes, higher peripheral insulin exposure can make fat storage easier and fat release harder. A useful mental model is two “doors” on the fat cell:
- The storage door (via lipoprotein lipase activity) can be pushed open by insulin
- The exit door (via hormone-sensitive lipase activity) can be held shut by insulin
When circulating insulin is high, fat can be stored readily while being difficult to mobilise. People can end up feeling like they are starving from the outside and the inside: reduced intake, but poor access to stored fuel. It is not a character flaw. It is an energetic access problem.
What this means in practice
- Insulin resistance in type 1 diabetes is driven by the same biological mechanisms as type 2, compounded by the portal–peripheral mismatch from subcutaneous insulin delivery
- Total daily insulin per kilogram is a useful tracking signal — it helps identify direction of travel and choose sensible interventions
- The Ominous Octet provides a map of eight biological levers — most people have more than one mechanism active at the same time
- Fat loss with muscle preservation is possible but requires deliberate strategy because peripheral insulin exposure can make it structurally harder
- Exploring your own U/kg trend over time with your care team is a valuable starting point
This content is for educational exploration only. It describes average responses and general principles. It is not medical advice and cannot replace individual clinical guidance from your diabetes care team.
Thank you for your insightful post. I’m currently working on a project related to insulin resistance in type 1 diabetes and was particularly interested in the insulin dose thresholds you shared:
“1.0 U/kg: High insulin resistance (approx. 10%)”
I haven’t been able to find any published reference for these thresholds. Would you mind sharing if these are based on any specific source or study, or if they were derived based on unpublished data?
Thanks again!
I am looking for data in adults, of course, and the whole range you introduced, not just >1.0 U/kg.
Thanks
See the section – I have imputed them from – https://diabetesjournals.org/care/article/42/4/657/36097/Association-of-Insulin-Dose-Cardiometabolic-Risk
Thank you. I am familiar with that paper. Could you please explain how you impute these thresholds from their data?
Here are the steps: for example 2
Step 1: Estimate the Mean and Standard Deviation
Step 2: Use the Normal Cumulative Distribution Function (CDF)
Step 3: Apply to Each Bin
Thank you for the hint—it does help for deriving the percentage of people with T1D in each category. But what’s the basis for the specific cut points, like “0.7–1.0 U/kg → Significant insulin resistance”?